
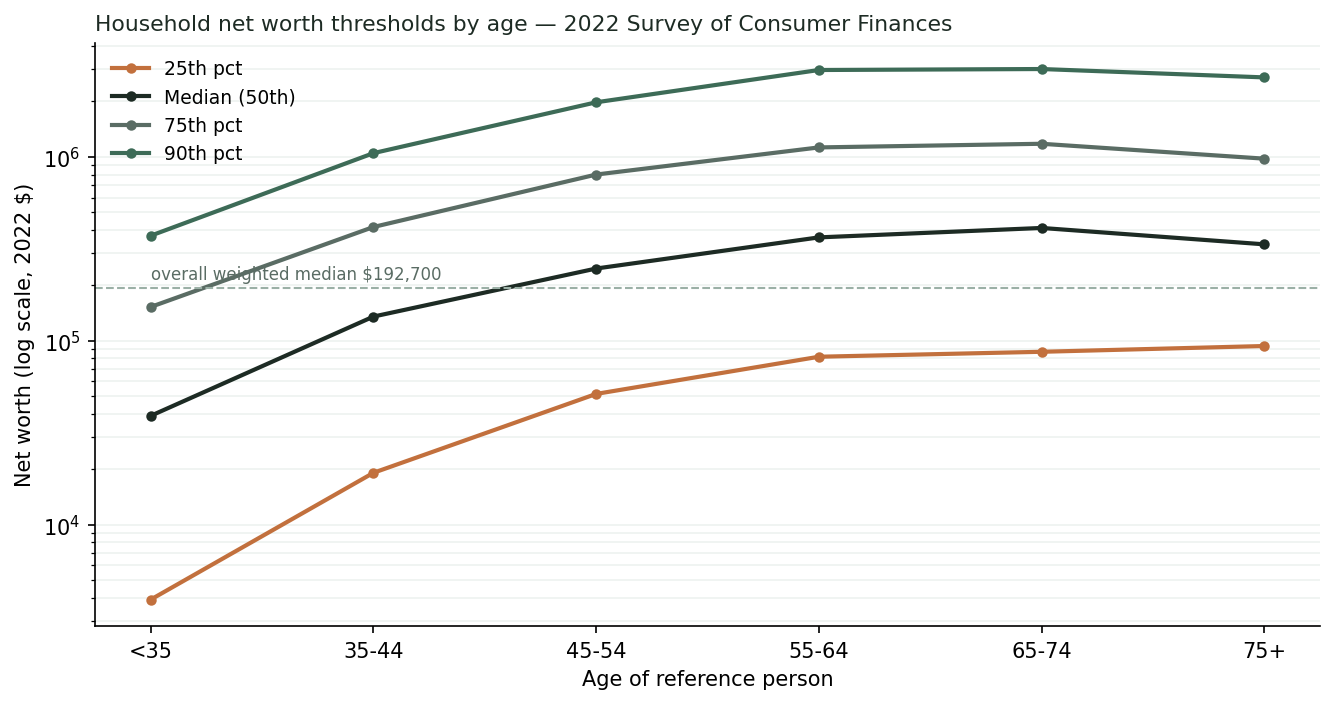
The Federal Reserve's 2022 Survey of Consumer Finances shows where U.S. household net worth stands at each age — the middle of each age group alongside the rungs above it. Among households headed by someone 45–54, the median net worth is about $247,000; the 75th percentile sits near $800,000 and the 90th near $2.0 million. The thresholds below pair the median (where the middle of an age group stands) with the 75th and 90th percentiles (where the top quarter and top tenth begin), so the top numbers read as the top of the distribution, not the middle of it.
Across all ages, the weighted overall median household net worth is $192,700 — and that figure is also the methodology check: it matches the Federal Reserve's own published 2022 median to the dollar, which is how we confirm the survey weighting is handled correctly (more on that below).

The thresholds, by age
| Age of household head | Median (50th) | Top 25% begins (75th) | Top 10% begins (90th) | 25th pct |
|---|---|---|---|---|
| Under 35 | $39,000 | $153,000 | $372,000 | $4,000 |
| 35–44 | $135,000 | $415,000 | $1.05M | $19,000 |
| 45–54 | $247,000 | $800,000 | $1.98M | $51,000 |
| 55–64 | $364,000 | $1.12M | $2.96M | $82,000 |
| 65–74 | $410,000 | $1.18M | $3.00M | $87,000 |
| 75+ | $334,000 | $976,000 | $2.70M | $94,000 |
The median peaks for households 65–74 at about $410,000 and slips for the 75-and-over group (about $334,000), as people draw down assets in later retirement. The 90th-percentile threshold runs from about $372,000 under 35 to roughly $3.0 million at 65–74.
The spread within an age group widens with age — in dollars
How far apart the top and bottom of an age group are moves two different ways as people get older, and it is worth keeping them straight. The dollar gap between the 90th and 25th percentiles widens sharply with age — from about $368,000 under 35 to roughly $2.9 million for households 55–74. The ratio, by contrast, compresses — from about 95× under 35 down to about 29× at 75-plus — because the 25th percentile climbs off a near-zero base while the top grows more slowly in proportional terms. Both are true; they describe the same distribution from different angles.
How we built this
Figures are weighted household net worth percentiles from the Federal Reserve's 2022 Survey of Consumer Finances (Summary Extract public dataset, rscfp2022). The SCF requires its survey weights and its five implicates (multiple imputation); we use each household's weight and pool across all five implicates. The check that this is done right: our weighted overall median net worth comes out to $192,700, which matches the Federal Reserve's published 2022 median exactly. The SCF is conducted every three years; 2022 is the latest available wave, so these are 2022 dollars for households as of that survey.
Percentiles are cross-sectional cut-points for households grouped by the age of the reference person — they describe the distribution, not the path of any one household over time. Net worth is total assets minus total liabilities, including home equity and retirement accounts.
Sources
Federal Reserve Board — Survey of Consumer Finances (2022), Summary Extract Public Data (rscfp2022); weighted, pooled across all five implicates. Canopy Press analysis.