
The conventional affordability rule says housing should take no more than 30% of income. In 2024 the households with the most room under that ceiling were the ones who least needed it: the highest-earning fifth of U.S. households held housing to 16.6% of reported pre-tax income and the fourth fifth to 24.2%, while the middle fifth — the median American household, whose income figure is just as reliable — spent 32.4%, already over the line. Below that, measured shares rise steeply, with a caveat we flag in the table.
Measured the robust way — as a share of what households actually spend, which sidesteps a known income-reporting artifact at the bottom of the distribution — the gradient is just as clear: housing took 41.6% of the lowest fifth's total spending versus 29.3% at the top, a 12.3-point spread. The lowest fifth has given up roughly 40 cents or more of every spending dollar to housing in every year of the past decade (decade range 40.0%–42.9%, to one decimal).
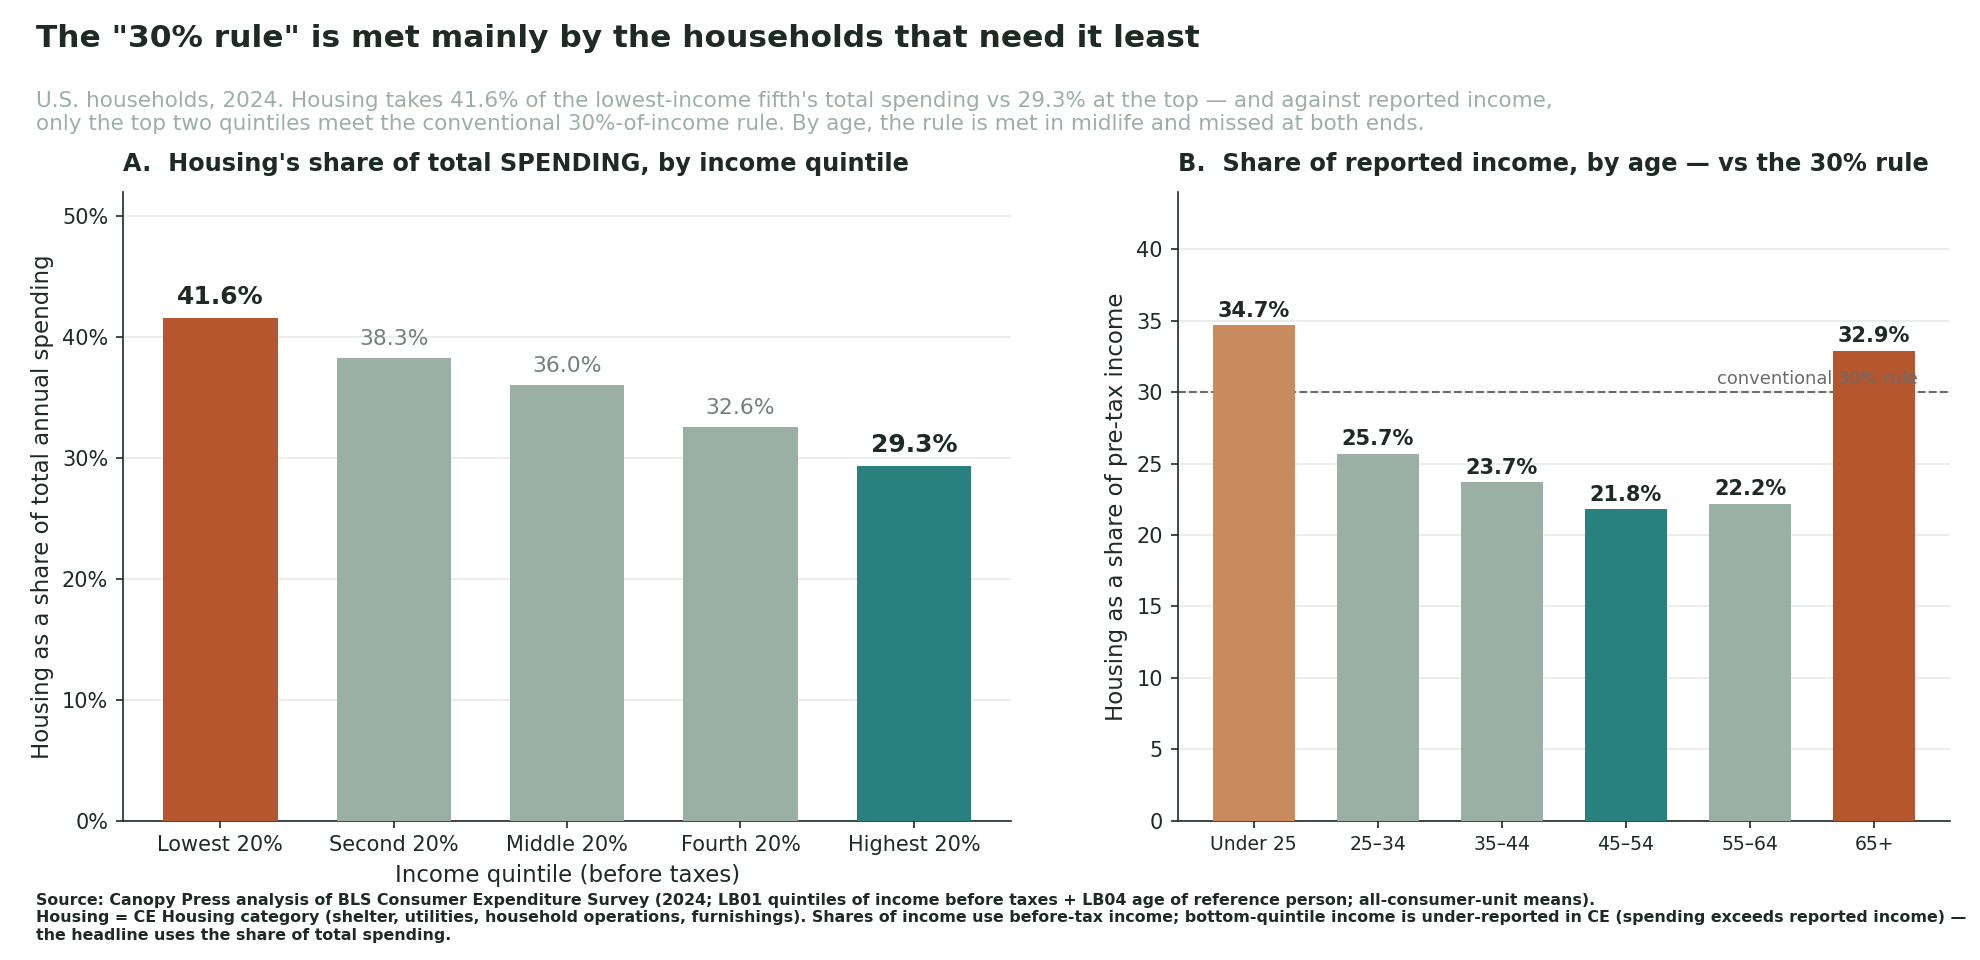

By income quintile (2024)
| Income quintile | Housing (mean) | Total spending (mean) | Pre-tax income (mean) | Share of spending | Share of reported income |
|---|---|---|---|---|---|
| Lowest 20% | $14,563 | $35,046 | $16,658 | 41.6% | 87.4% |
| Second 20% | $19,174 | $50,054 | $42,925 | 38.3% | 44.7% |
| Middle 20% | $24,093 | $66,900 | $74,474 | 36.0% | 32.4% |
| Fourth 20% | $29,374 | $89,972 | $121,548 | 32.6% | 24.2% |
| Highest 20% | $44,033 | $150,342 | $264,510 | 29.3% | 16.6% |
| All consumer units | $26,266 | $78,535 | $104,207 | 33.4% | 25.2% |
BLS Consumer Expenditure Survey 2024, quintiles of income before taxes; all-consumer-unit means. Housing = the CE Housing category (shelter, utilities, household operations, furnishings). Income-share reliability, by the survey's own numbers: CE under-reports income at the bottom of the distribution. The lowest quintile's average spending ($35,046) exceeds its average reported income ($16,658) outright — its 87.4% is not a literal budget share, only 'housing is very large relative to current reported income.' The second quintile fails the same test mildly ($50,054 vs $42,925); read its share as directional. The top three quintiles' income figures pass (reported income exceeds spending). The share-of-spending column is immune to this artifact for every quintile.
The regressive gradient, measured robustly
Because the bottom-quintile income figure is unreliable, the honest cross-quintile comparison is housing's claim on total spending — a consumption share that does not touch reported income at all. On that measure the burden falls monotonically as income rises: 41.6% → 38.3% → 36.0% → 32.6% → 29.3% from the lowest fifth to the highest. Housing is the largest single claim on the budgets of the households with the least room to economize elsewhere — and that has been true every year for a decade (Block 2 of the CSV carries the full 2014–2024 series; the 2020 pandemic year peaked at 42.9%).
Against reported income, the inversion of the 30% rule rests on the quintiles whose income figures pass our own reliability test (average reported income exceeding average spending — the top three): the top fifth sits at 16.6% and the fourth at 24.2% — comfortably under the ceiling — while the middle fifth, at 32.4%, misses it. The second quintile's measured 44.7% fails that same test mildly (spending $50,054 vs reported income $42,925), so we read it as directional only — under-reported income inflates a measured share, and the true figure would be lower, though it would have to fall by a third to reach the 30% line. A rule expressed as a flat share of income is, in practice, a description of how high-income households already live.
By age: the rule is met in midlife, missed at both ends
| Age of reference person | Housing (mean) | Share of spending | Share of pre-tax income |
|---|---|---|---|
| Under 25 | $16,853 | 35.6% | 34.7% |
| 25-34 | $26,380 | 35.4% | 25.7% |
| 35-44 | $30,369 | 33.3% | 23.7% |
| 45-54 | $30,747 | 30.6% | 21.8% |
| 55-64 | $27,019 | 31.8% | 22.2% |
| 65+ | $22,193 | 36.1% | 32.9% |
The age cut is free of the income-reporting artifact (reported income exceeds total spending in every age bracket), so its income shares can be read directly. They trace a U: households headed by someone under 25 put 34.7% of pre-tax income toward housing and the 65+ group 32.9% — both above the 30% line — while peak-earning 45-to-54-year-old households sit at 21.8%, the lightest burden of any bracket. The under-25 cell is thin and shown for completeness, not as a headline figure.
Methodology
The metric. Housing = the BLS Consumer Expenditure Survey Housing category — shelter (rent, or owners' costs such as mortgage interest, property taxes, insurance, maintenance), utilities, household operations, and furnishings — as the consumer-unit annual mean. Utilities are inside the Housing category (shown separately in the CSV, never added on top). The burden is that housing figure divided by (a) total average annual expenditures — the share-of-spending measure the headline uses — and (b) income before taxes, both from the same survey and the same units.
Sources.
- BLS Consumer Expenditure Survey (LABSTAT), classification
LB01= quintiles of income before taxes; itemsHOUSING,UTILS,TOTALEXP,INCBEFTX, 2014–2024 annual. Classification verified against the published 2024 all-consumer-unit figure (total expenditures $78,535) and BLS's own API catalog titles. - Same survey, classification
LB04= age of reference person, 2024 — staged snapshot with a deterministic offline recompute (the age figures in this page reproduce bit-for-bit from the pinned raw file).
What this measures — and what it doesn't. CE figures are all-consumer-unit means (renters and owners together), not medians; means are pulled up by large units. These are expenditure shares — what households actually spent — not an affordability index, a quality-adjusted cost, or a statement about house prices. Income shares use before-tax income, the conservative choice: after-tax denominators would push every share higher. We make no claim about any individual household; a flat-share rule will always fit some budgets and not others — the finding is about where, in the income and age distributions, the conventional threshold is actually met.
Confidence. High for the share-of-spending gradient and the age gradient — direct arithmetic on published federal survey means, regression-checked and recomputable offline. Medium for share-of-reported-income levels: the bottom-quintile figure is flagged as non-literal everywhere it appears, and the 30%-rule comparison rests on the quintiles whose income figures pass the spending-vs-income reliability test (the top three), with the second quintile read as directional only, and on the artifact-free age cut.
Transformed figures are Canopy Press's analysis of the underlying federal data, not “BLS data.” Reuse permitted with attribution to Canopy Press (CC BY 4.0). Full underlying figures: CSV download.
Further reading from Canopy Press
Cite or reuse this data (CC BY 4.0 with attribution):
Canopy Press (2026). “The “30% rule” for housing is met mainly by the households that need it least.” https://canopy.press/research/housing-cost-burden-by-income-and-age-2024/
Journalists: data questions answered at [email protected]. New research lands first in The Canopy Brief (weekly, free).