
In 2024, U.S. households headed by a 25-to-34-year-old spent 11.6% of their pre-tax income on transportation costs (excluding public transit) — virtually identical to the 11.2% spent by peak-earning 45-to-54-year-olds, who earn about $39,000 more a year ($102,500 vs $141,100 in mean pre-tax income).
Put another way: early-career households carry the same car-cost burden, measured as a share of income, as households in their peak-earning years — despite a roughly 38% income gap between them. The finding is a share-of-income comparison, car costs only (public transit removed), built from federal survey data.
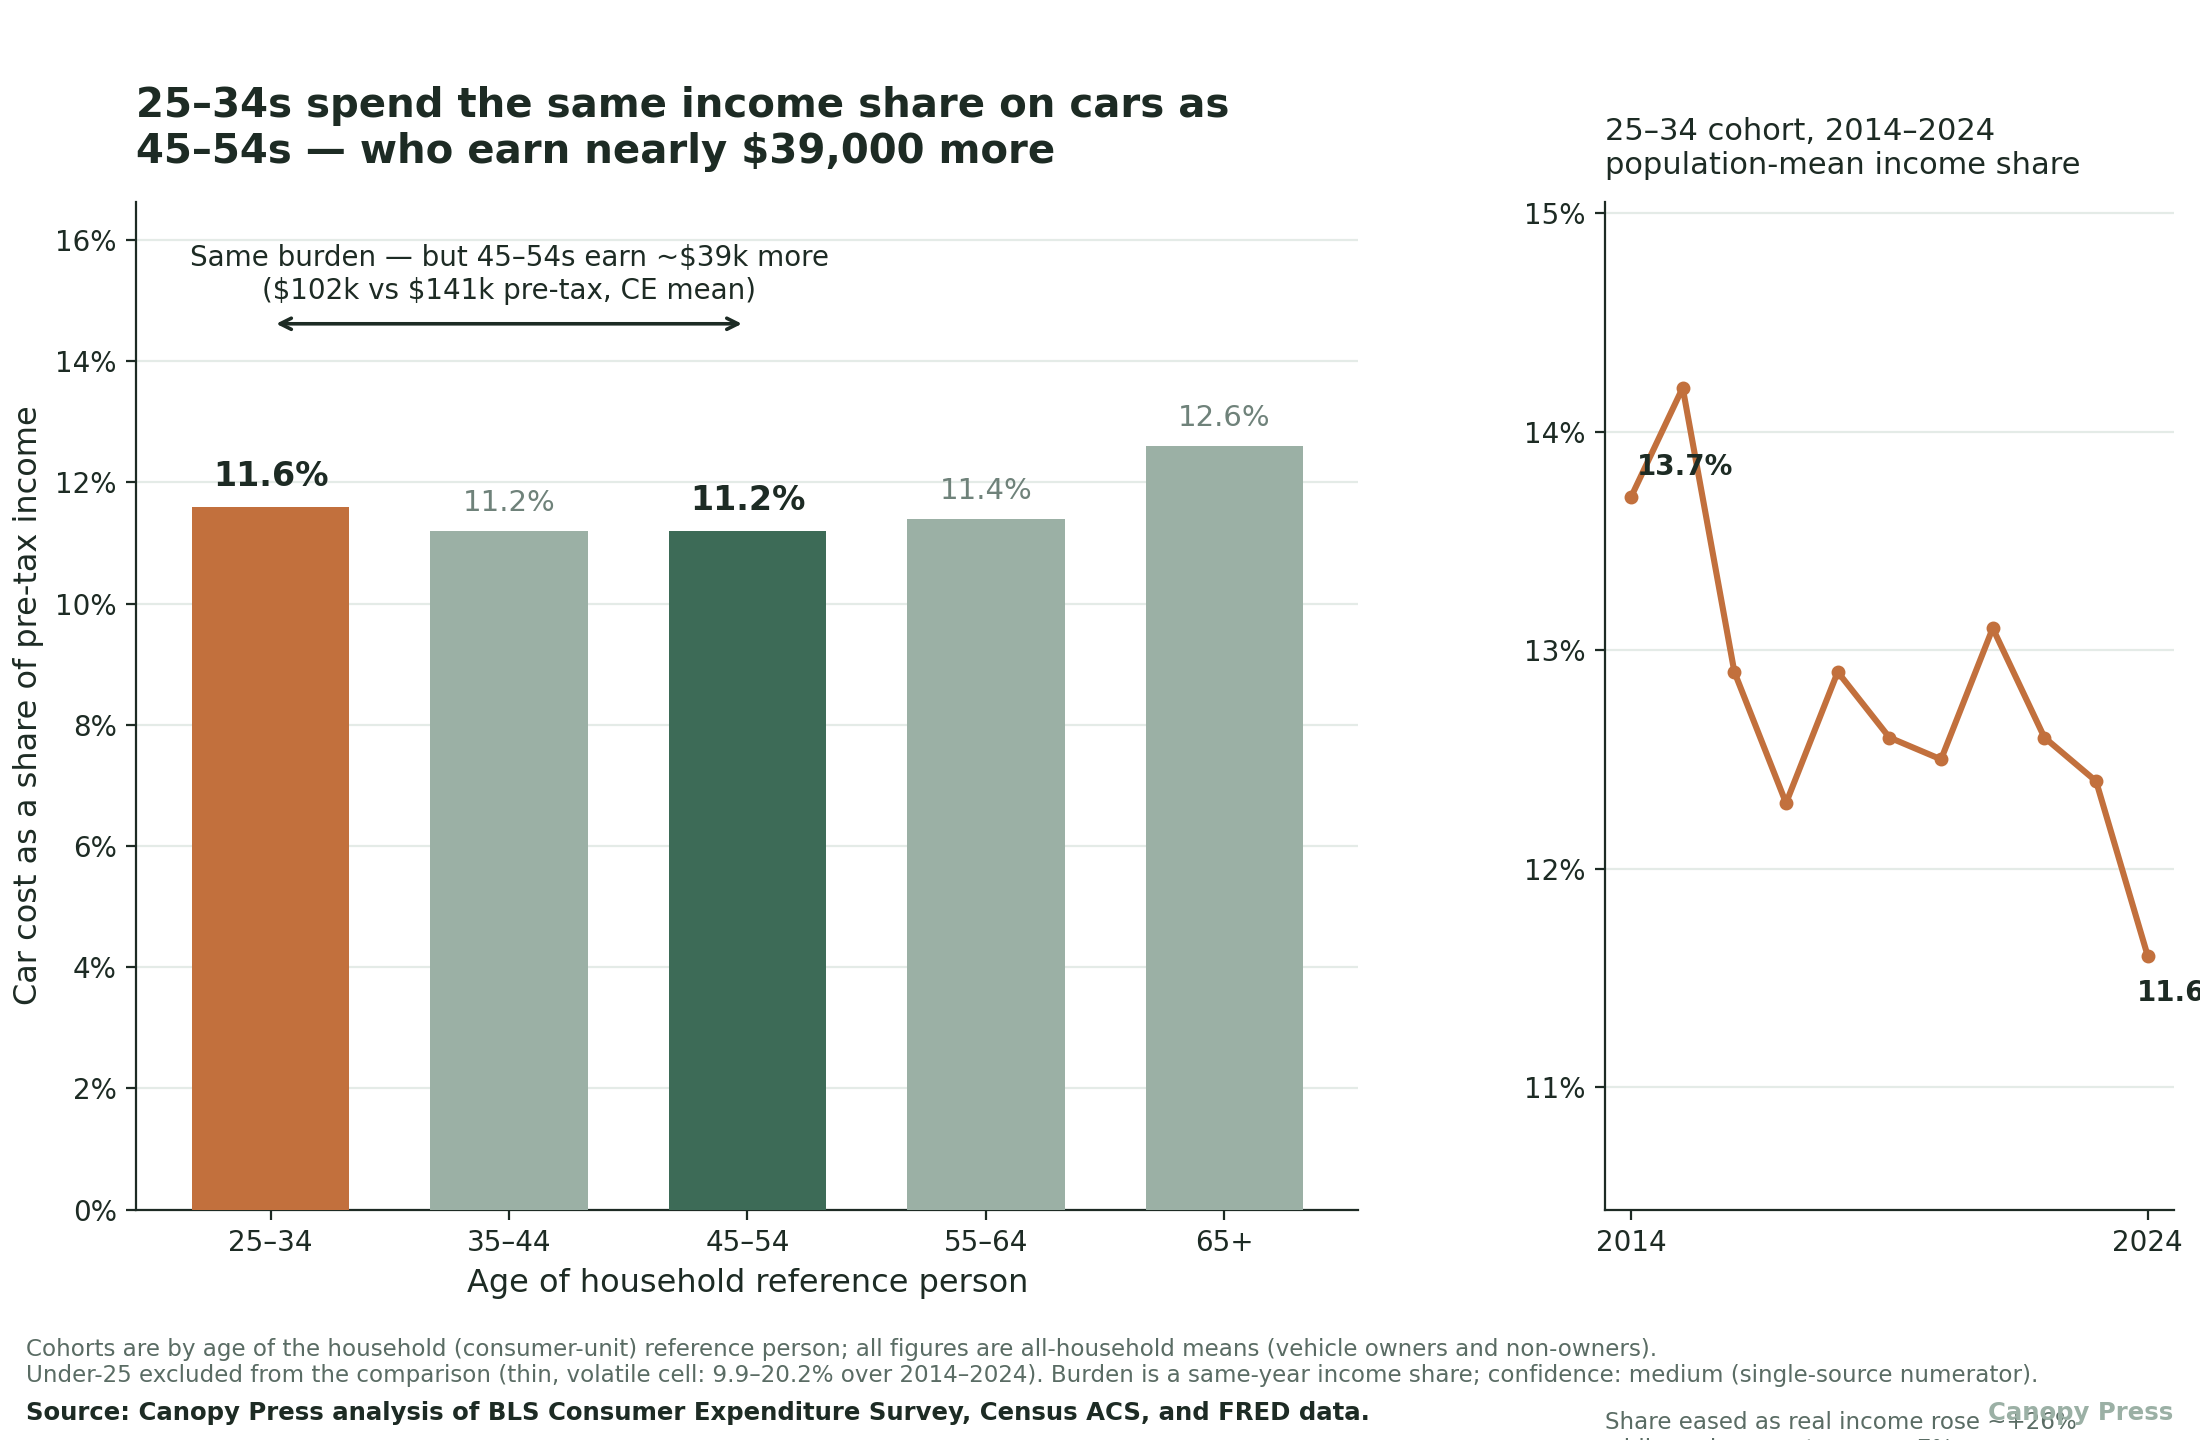

The cross-section, 2024
| Age of reference person | Car cost (mean) | Pre-tax income (mean) | Burden (% of income) |
|---|---|---|---|
| 25–34 | $11,899 | $102,494 | 11.6% |
| 35–44 | $14,363 | $128,285 | 11.2% |
| 45–54 | $15,747 | $141,121 | 11.2% |
| 55–64 | $13,823 | $121,571 | 11.4% |
| 65+ | $8,514 | $67,462 | 12.6% |
| All households | $12,187 | $104,207 | 11.7% |
Under-25 households are excluded from the headline comparison: that cell is thin and volatile (burden swings 9.9%–20.2% across 2014–2024). All figures are all-household (consumer-unit) means spanning vehicle owners and non-owners.
The decade trend (population-mean fact)
For the 25-to-34 cohort, the car-cost income share eased from 13.7% in 2014 to 11.6% in 2024. The honest read is arithmetic, not affordability defiance: as population means, the cohort’s real (inflation-adjusted) vehicle costs rose modestly — about +7% over the decade in 2024 dollars (roughly +42% before adjusting for inflation) — while its real income rose more, about +26%. Because the denominator grew faster than the numerator, the income share fell.
We are not claiming young people shrugged off higher car prices or interest rates. The 48-month new-car loan rate did roughly double over the window (about 4.2% in 2014 to 8.5% in 2024, per FRED), but we draw no “defiance” conclusion from that — see the composition caveat below.
Methodology
The metric. Car cost = BLS Consumer Expenditure Survey Transportation minus Public transportation (consumer-unit mean, annual) — i.e., the cost of owning and running a private vehicle: net vehicle purchase outlay, fuel, insurance, finance charges, maintenance, and registration, with transit fares removed. Burden = that car cost divided by CE income before taxes (same survey, same units), per age-of-reference-person bracket. Because numerator and denominator are the same-year nominal figures from one survey, inflation cancels in the ratio.
Sources.
- BLS Consumer Expenditure Survey (LABSTAT):
CXU…TRANS,PUBTRANS, andINCBEFTXby age of reference person (Table 1300), 2014–2024 annual. Bracket codes verified empirically (2023 all-CU total expenditure $77,280 matched the published figure). - U.S. Census American Community Survey 1-year,
B19049(median household income by age of householder, 2024) — independent corroboration of the income denominator. - FRED
TERMCBAUTO48NS(48-month new-car loan rate) andCPIAUCSL(CPI-U, for the real-dollar adjustment).
All figures are all-household means. Every burden, car-cost, and income number is a consumer-unit mean spanning owners and non-owners within each age bracket. The cross-cohort comparison is therefore a like-for-like population-mean comparison, not a per-owner comparison.
Composition caveat (important for the trend). The 2014→2024 decline in the 25–34 income share cannot be cleanly split into per-owner affordability versus a change in the ownership rate. An all-household mean is approximately the ownership rate times cost-per-owner, so a rising mean is compatible with a falling ownership rate. No age-by-vehicle-ownership time series was cleanly available through the wired data sources, so a composition contribution (fewer young owners over time) cannot be ruled out. We present the trend only as the population-mean fact above — not as evidence that per-owner affordability improved.
Confidence: medium. The income denominator is cross-validated across two independent surveys (CE mean vs Census ACS median, consistent given expected right-skew). The car-cost numerator rests on the BLS CE alone — no independent by-age household vehicle-spending series exists. The 25–34 vs 45–54 comparison is robust; absolute dollar levels are CE-dependent and definition-sensitive (mean vs median, before vs after tax).
Transformed figures are Canopy Press’s analysis of the underlying federal data, not “BLS data.” Reuse permitted with attribution to Canopy Press (CC BY 4.0). Full underlying figures: CSV download.
Further reading from Canopy Press
Cite or reuse this data (CC BY 4.0 with attribution):
Canopy Press (2026). “25-to-34-year-olds spend the same share of income on cars as 45-to-54-year-olds — who earn nearly $39,000 more.” https://canopy.press/research/car-cost-income-burden-by-age-2024/
Journalists: data questions answered at [email protected]. New research lands first in The Canopy Brief (weekly, free).