
The standard emergency-fund rule — keep 3 to 6 months of expenses in reserve — is one number. The reality it describes is not. In 2024 a three-month cushion meant about $8,762 for the lowest-income fifth of U.S. households and about $37,586 for the highest — a 4.29× range built from the very same rule.
Setting that money aside would absorb very different shares of a year's income. For the lowest fifth, a three-month fund equals roughly 53% of average annual pre-tax income; for the highest fifth, about 14%. The share of income the rule asks a household to bank runs opposite to income — it is largest for the households with the least room to spare. And those are the households least likely to have reached the target: in the Federal Reserve's 2024 survey, 24% of adults earning under $25,000 had three months of emergency savings, versus 75% of those earning $100,000 or more.
This is a description of measured federal data, not financial advice and not a verdict on the rule. The numbers simply show that a single flat target lands very differently depending on where a household sits in the income distribution.
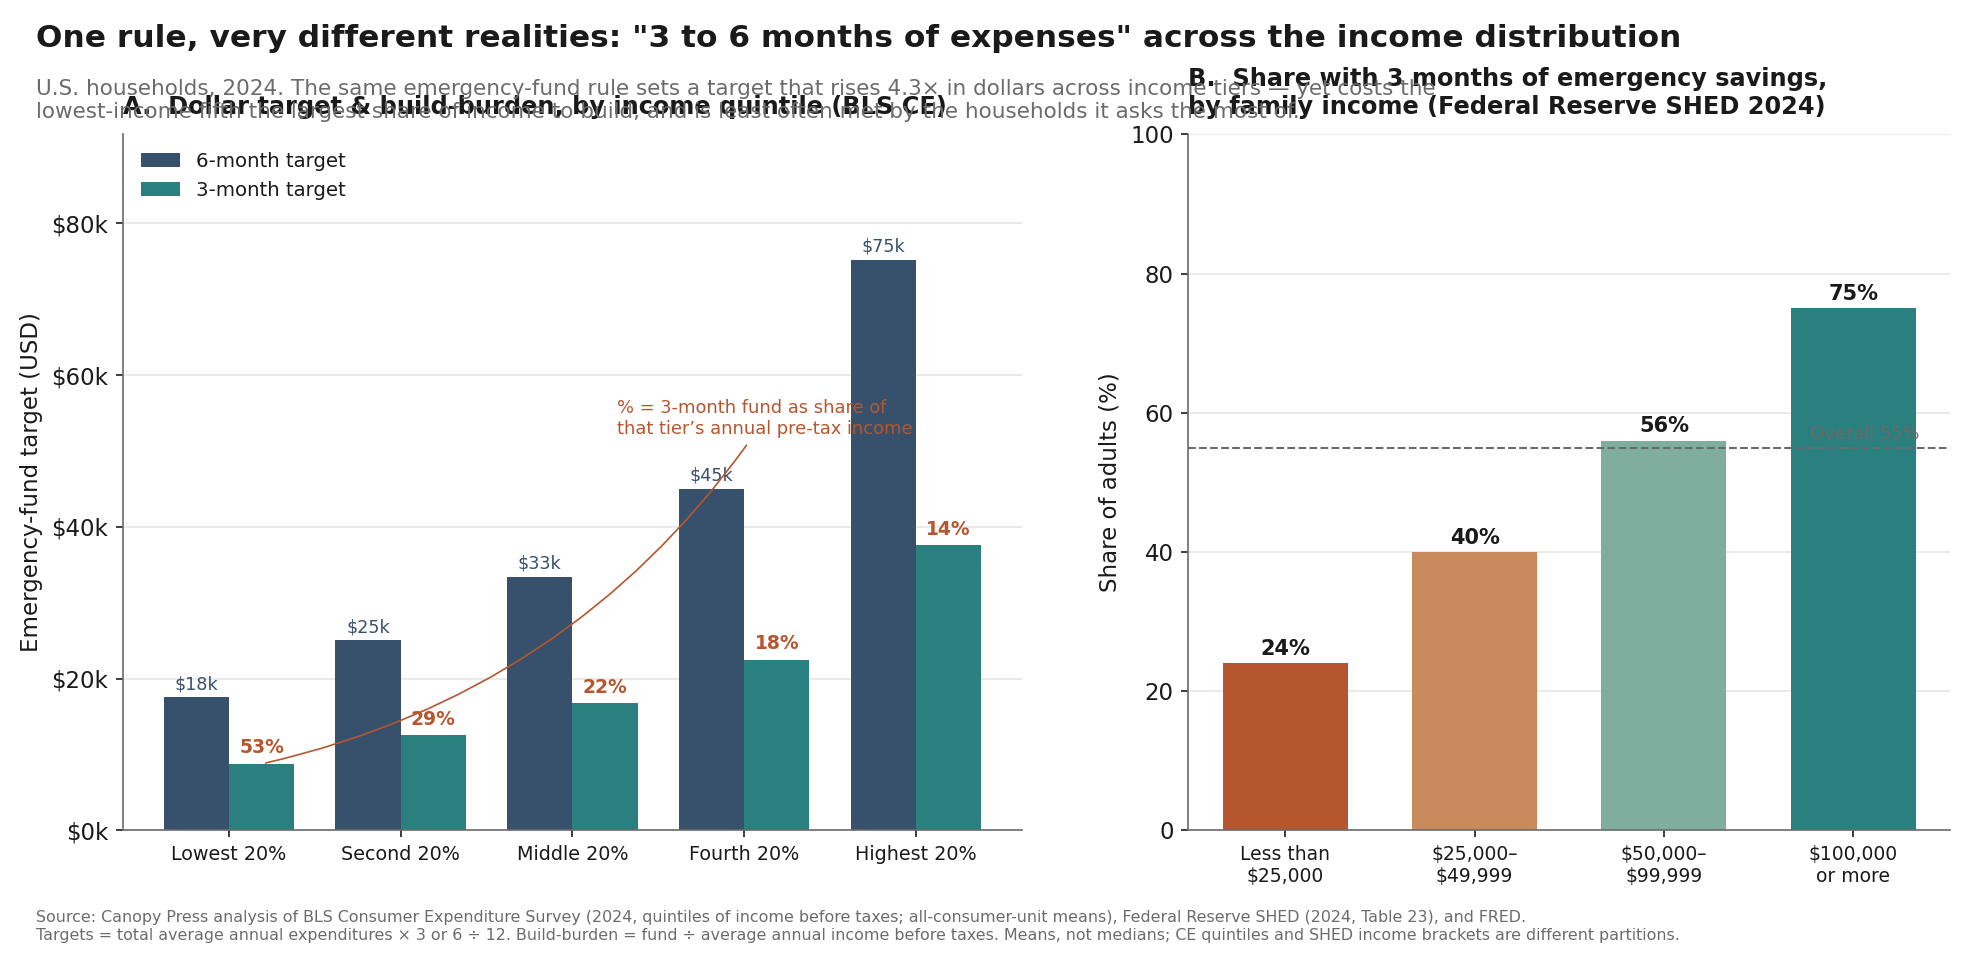

The dollar target, by income quintile (2024)
| Income quintile | Annual spending (mean) | 3-month fund | 6-month fund | Pre-tax income (mean) | 3-mo fund / income |
|---|---|---|---|---|---|
| Lowest 20% | $35,046 | $8,762 | $17,523 | $16,658 | 53% |
| Second 20% | $50,054 | $12,514 | $25,027 | $42,925 | 29% |
| Middle 20% | $66,900 | $16,725 | $33,450 | $74,474 | 22% |
| Fourth 20% | $89,972 | $22,493 | $44,986 | $121,548 | 18% |
| Highest 20% | $150,342 | $37,586 | $75,171 | $264,510 | 14% |
| All consumer units | $78,535 | $19,634 | $39,268 | $104,207 | 19% |
BLS Consumer Expenditure Survey, 2024, quintiles of income before taxes. All figures are all-consumer-unit means (owners and non-owners, working and retired), not medians. “3-month fund” = total average annual expenditures × 3 ÷ 12.
The build-burden runs opposite to income
Because lower-income households spend a much larger share of their income — the lowest fifth's average annual spending ($35,046) actually exceeds its average reported pre-tax income ($16,658) — a fund sized in “months of expenses” represents a far bigger bite of their income. A six-month fund equals about 105% of the lowest fifth's annual pre-tax income (more than a full year) versus about 28% for the highest. The flat rule is blunt in this specific, measurable sense: it asks the largest income share of the households least able to spare it.
That the lowest quintile spends more than its reported income is a well-known feature of the Consumer Expenditure Survey — the group includes retirees and students drawing down assets, transfer recipients, and households with temporarily low or under-reported income. So the 53% figure is best read as “the target is large relative to current reported income,” not as a literal claim that such a household must save half its take-home pay.
Who has actually reached three months (SHED 2024)
| Family income | Have 3 months of emergency savings |
|---|---|
| Less than $25,000 | 24% |
| $25,000-$49,999 | 40% |
| $50,000-$99,999 | 56% |
| $100,000 or more | 75% |
| Overall | 55% |
Federal Reserve, Report on the Economic Well-Being of U.S. Households in 2024 (May 2025), Table 23. Among all adults; self-reported. Overall, the personal saving rate was 2.6% as of 2026-04 (FRED PSAVERT).
Methodology
The metric. The emergency-fund target is N months of spending, where monthly spending = BLS Consumer Expenditure Survey total average annual expenditures ÷ 12 for the income group, and N = 3 or 6 per the common rule. The build-burden is that target divided by the group's average annual income before taxes (same survey, same units) — i.e., a one-time target expressed as a fraction of one year's pre-tax income. It is not a savings rate or a time-to-build estimate.
Sources.
- BLS Consumer Expenditure Survey (LABSTAT), classification
LB01= quintiles of income before taxes; itemsTOTALEXPandINCBEFTX, 2024 annual. Classification verified empirically (all-consumer-unit total expenditure $78,535 matched the published 2024 figure; quintile income before taxes is monotonic, $16,658 to $264,510). - Federal Reserve Survey of Household Economics and Decisionmaking (SHED), 2024 report (May 2025), Table 23 — share with three months of emergency savings by family income.
- FRED
PSAVERT(personal saving rate), context.
Two different income partitions. The dollar targets and build-burden use CE income quintiles; the coverage figures use SHED's fixed-dollar income brackets. These are not a single continuous axis and are presented as parallel, same-direction evidence. The lowest quintile's mean income (~$16,700) sits inside SHED's “under $25,000” band; the highest quintile's mean (~$264,500) sits inside “$100,000 or more.”
Means, essentials, and taxes. CE figures are means and are right-skewed, especially in the top quintile; medians would compress but not reverse the spread. Using an essentials-only basket (housing, food at home, health, private transportation) lowers every target — the lowest fifth's three-month essentials fund is about $6,621 — but the 4-plus-times spread and the burden inversion persist; essentials are about 76% of total spending for the bottom fifth versus 57% for the top. Using after-tax income would raise the build-burden percentages; before-tax is the conservative choice.
Confidence. High for the dollar-target spread (direct arithmetic on published means) and the SHED coverage gap (a published table). Medium for the build-burden interpretation, which is sensitive to the before- vs after-tax choice and to CE income under-reporting at the bottom; the direction (burden falls as income rises) is robust.
Transformed figures are Canopy Press's analysis of the underlying federal data, not “BLS data” or “Fed data.” Reuse permitted with attribution to Canopy Press (CC BY 4.0). Full underlying figures: CSV download.
Further reading from Canopy Press
Cite or reuse this data (CC BY 4.0 with attribution):
Canopy Press (2026). “One rule, very different realities: what “3 to 6 months of expenses” actually costs across the income distribution.” https://canopy.press/research/emergency-fund-adequacy-by-income-2024/
Journalists: data questions answered at [email protected]. New research lands first in The Canopy Brief (weekly, free).