The True Cost of Raising a Child in 2026: A State-By-State Breakdown
Raising a child to 18 now costs $303,418 — more than the median U.S. home — and geography alone can swing the bill by $210,000.
- The $303,418 Price Tag: How Inflation Keeps Adding to Child-Rearing Costs
- State-by-State Cost Disparities: From Hawaii's $412,661 to New Hampshire's $201,963
- Inflation's Hidden Toll: How 3.7% Still Hurts Families' Bottom Lines
- Saving Strategies for Parents: Beat Inflation with 529 Plans and High-Yield Accounts
- The 2026 Cost Map: Top 5 Most and Least Expensive States to Raise a Child
- Sources
- Bottom Line
The $303,418 Price Tag: How Inflation Keeps Adding to Child-Rearing Costs
Raising a child in the U.S. now costs $303,418 from birth to age 18, per LendingTree's 2026 report. It's the first time the figure has crossed $300,000 — and it didn't happen because of any single shock. Four years of compounding inflation repriced everything from diapers to daycare.
Data as of: May 30, 2026. This article is informational, not financial advice.
Key Takeaways
- The national average is now $303,418 for birth to age 18 — up from $297,674 in 2025 and the first time the figure has crossed $300,000.
- Geography swings the bill by $210,698. Hawaii tops out at $412,661 over 18 years; New Hampshire bottoms at $201,963.
- Child-rearing inflation runs roughly 60% faster than headline CPI, driven by licensed child care, housing, and pediatric healthcare.
- Three accounts close most of the gap: a 529 plan, a high-yield savings account, and the Child Tax Credit (CTC) — worth roughly $123,000 in combined offsets and growth over 18 years.
Run the macro math. Consumer Price Index (CPI) inflation peaked at 9.1% in June 2022, according to Bureau of Labor Statistics (BLS) data. Annual averages were 8.0% in 2022, 4.1% in 2023, 2.9% in 2024, and the latest April 2026 reading sits at 3.7%. Compounded, that's roughly 19% cumulative inflation in four years. A box of diapers that cost $20 in early 2022 costs about $23.80 today, and a year of infant care that cost $11,000 then is closer to $13,090 now, before any state-specific premium.
The Consumer Price Index hit 332.4 in April 2026, per Federal Reserve Economic Data (FRED) — up from roughly 289 in April 2022. That cumulative jump means a $297,674 national child-rearing total from 2025 now has to be funded with dollars that buy noticeably less than they did three years ago.
The 1.9% year-over-year (YoY) increase reported by LendingTree looks tame next to the 3.7% headline CPI. The reason: the 2025 base was already elevated. Some categories actually rolled back modestly (used cars, certain electronics), while child-specific costs — formula, infant care, pediatric copays — stayed sticky. The slower top-line number hides the fact that the categories parents can't avoid kept rising faster than the average.
SmartAsset's separate 2025 study makes this even starker. Its measure — annual cost for a working couple with one preschooler in licensed care — rose 4.5% year over year, well above the 2.82% headline CPI that year. Child-rearing inflation has been running roughly 60% faster than the overall consumer basket for the past two years.
For parents budgeting forward, even a glide path back to the Federal Reserve's 2% target by 2027 doesn't roll anything back. The costs already in place are permanent. The $303,418 is the floor, not the ceiling.
State-by-State Cost Disparities: From Hawaii's $412,661 to New Hampshire's $201,963
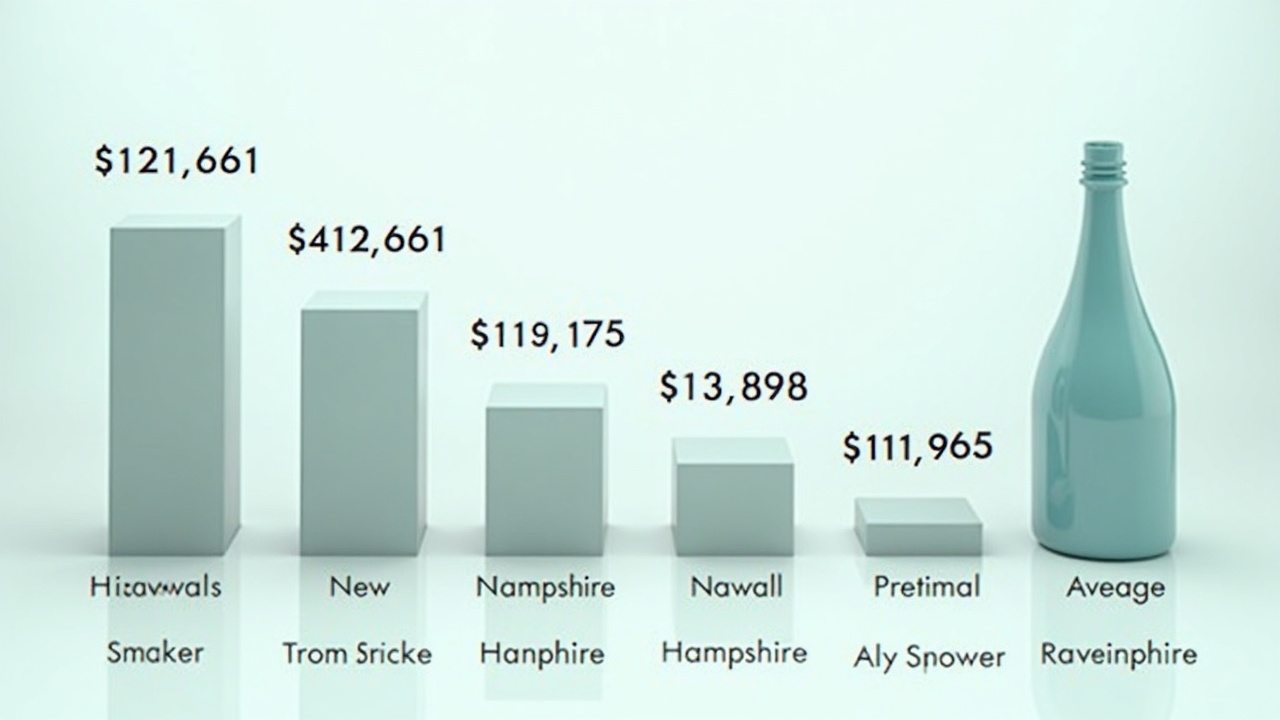
The national average hides a $210,698 gap. Raising a child in Hawaii costs more than twice what it costs in New Hampshire, and the difference comes down to geography, not lifestyle.
The single biggest driver is child care, followed by housing. Hawaii's early-childhood costs alone run $40,342 per year on average for the first five years, per (https://www.lendingtree.com/). Add in the highest grocery prices in the country (everything ships in), a 30-year fixed mortgage at 6.53% per FRED, and a statewide median single-family home price of $846,500 as of Q1 2026 per the Hawaii Association of Realtors, and the math compounds quickly.
Here are the 2026 extremes among the 50 states. The District of Columbia is reported separately by LendingTree because it's a federal district, not a state:
| Rank | State | 18-Year Total | vs. National Avg ($303,418) |
|---|---|---|---|
| 1 (Most expensive) | Hawaii | $412,661 | +36.0% |
| 2 | Alaska | $365,047 | +20.3% |
| 3 | Maryland | $326,360 | +7.6% |
| 49 | South Carolina | $204,213 | −32.7% |
| 50 (Least expensive state) | New Hampshire | $201,963 | −33.4% |
The District of Columbia, reported separately, comes in at $202,115 — between South Carolina and New Hampshire.
Source: LendingTree 2026 Cost of Raising a Child Report.
The year-over-year movers are equally revealing. Nebraska saw early-years costs jump 27.4%, with Montana up 24.5%, Maine 24.4%, and Wisconsin 23.3%, per LendingTree. These are inland markets where licensed child care supply collapsed post-pandemic and is only now repricing. New Hampshire moved the opposite direction, falling 19.5% YoY as child care availability normalized.
SmartAsset's annual-cost lens tells a parallel story. Its 2025 study put Massachusetts at $44,221/year for a working couple with one preschooler — up 5.72% YoY and requiring household income of at least $124,842 to absorb, per SmartAsset. Connecticut came in at $41,808/year, Vermont at $38,272. At the other end: Mississippi at $19,178/year, Alabama at $20,550, Kentucky at $20,758, South Dakota at $21,174, Georgia at $21,299. The spread between Mississippi and Massachusetts is 2.3x for what is, in theory, the same year of parenting.
USDA expenditure data shows why housing and child care matter so much. Housing eats roughly 29% of total cost, child care 16%, and food a steadier 18%, per the USDA's Expenditures on Children by Families report. Food prices are roughly comparable nationally; housing and child care explode regionally. That's why the 50-state map looks the way it does.
Inflation's Hidden Toll: How 3.7% Still Hurts Families' Bottom Lines
Headline inflation at 3.7% sounds manageable until you sit down with the receipts. The Fed's 2% target is the benchmark a price-stable economy should run at — 3.7% means the cost of living is climbing nearly twice that pace. For a family already spending $20,000+ a year on a child, that's roughly $740 in new annual costs every year, before any wage adjustments.
There's also a wealth effect parents shouldn't ignore. The S&P 500 is up 10.5% year-to-date in 2026, sitting at 7,580.06 as of May 30, per Yahoo Finance. That 10.5% YTD gain meaningfully outpaces 3.7% inflation — but only if you were invested. Families holding cash through 2026 watched purchasing power erode while equity holders pulled ahead. A 529 plan in age-based equity index funds captures that gain; a checking account doesn't.
The harder hit is on the healthcare side. The Affordable Care Act (ACA) family out-of-pocket maximum — the worst-case bill a family with marketplace coverage can face before insurance covers 100% — rose to $21,200 in 2026 from $18,400 in 2025, a 15% jump in a single year, per HSA for America. That's the worst-case bill a family with marketplace coverage can face before insurance covers 100%. A single hospitalization can put a family at that ceiling, and the ceiling itself just moved up by $2,800.
Childbirth costs illustrate the pattern. The average total spend for an employer-insured delivery is now $20,416, with $2,743 in out-of-pocket costs, per the Peterson-KFF Health System Tracker. Uninsured deliveries run $6,900–$29,000. Layered onto already-tight family budgets, these aren't numbers you absorb without a savings strategy.
The federal funds rate at 3.64% per FRED means borrowing remains expensive but cash earns real return. That's the silver lining for families — done right, your savings can actually keep pace.
Saving Strategies for Parents: Beat Inflation with 529 Plans and High-Yield Accounts
If costs are rising at 3.7% and your money is sitting in a 0.01% annual percentage yield (APY) checking account, you're losing 3.69% of purchasing power every year. Three accounts do the heavy lifting.
Three concrete moves that move the needle:
- Open a 529 plan; contribute $200/month from birth. At a 7% long-run blended return — roughly the inflation-adjusted-plus-inflation return of a diversified equity portfolio, consistent with the long-run historical equity return profile cited in SEC investor.gov guidance — $200/month from birth to age 18 grows to approximately $86,000. That covers most of an in-state public college tuition without a single loan. Many states offer a state income tax deduction on contributions on top of federal tax-free growth.
- Move your emergency fund to a high-yield savings account. The 10-year Treasury yield is 4.45%, per FRED, and top high-yield savings accounts (HYSAs) are paying in the 4.2–4.5% APY range. An APY above the 3.7% CPI means your cash grows in real terms. A $25,000 emergency fund earning 4.4% generates roughly $1,100/year vs. roughly $3 in a standard checking account.
- Capture the full Child Tax Credit (CTC). The 2026 CTC is $2,200 per qualifying child under 17, with $1,700 refundable, per the IRS. Over 17 years, that's $37,400 in offsets — about 12% of the national total cost. Set your W-4 withholding so you capture it through the year rather than waiting on a refund.
For higher earners, the next layer is a Roth individual retirement account (IRA) in the child's name once they have earned income (typically from teen jobs), and using a Health Savings Account (HSA) — which is triple tax-advantaged — to cover pediatric out-of-pocket spending tax-free.
Get the free 2026 Budget Tracker Template
A plug-and-play monthly budget plus the 5-step system that makes it stick. Delivered instantly.
Free download. We email The Canopy Brief weekly. Unsubscribe anytime.
A family contributing $200/month to a 529 plan plus $300/month to a high-yield savings account at today's 4.45% rate would accumulate roughly $148,000 by the child's 18th birthday — nearly half the total cost of raising them — without ever taking on debt.
One trap to avoid: borrowing from your 401(k) to fund child costs. The opportunity cost — foregone compounding at 7% over 20+ years — turns a $20,000 withdrawal at age 35 into roughly $77,000 in lost retirement wealth by 65. Cover child costs from savings, never from retirement.
The 2026 Cost Map: Top 5 Most and Least Expensive States to Raise a Child
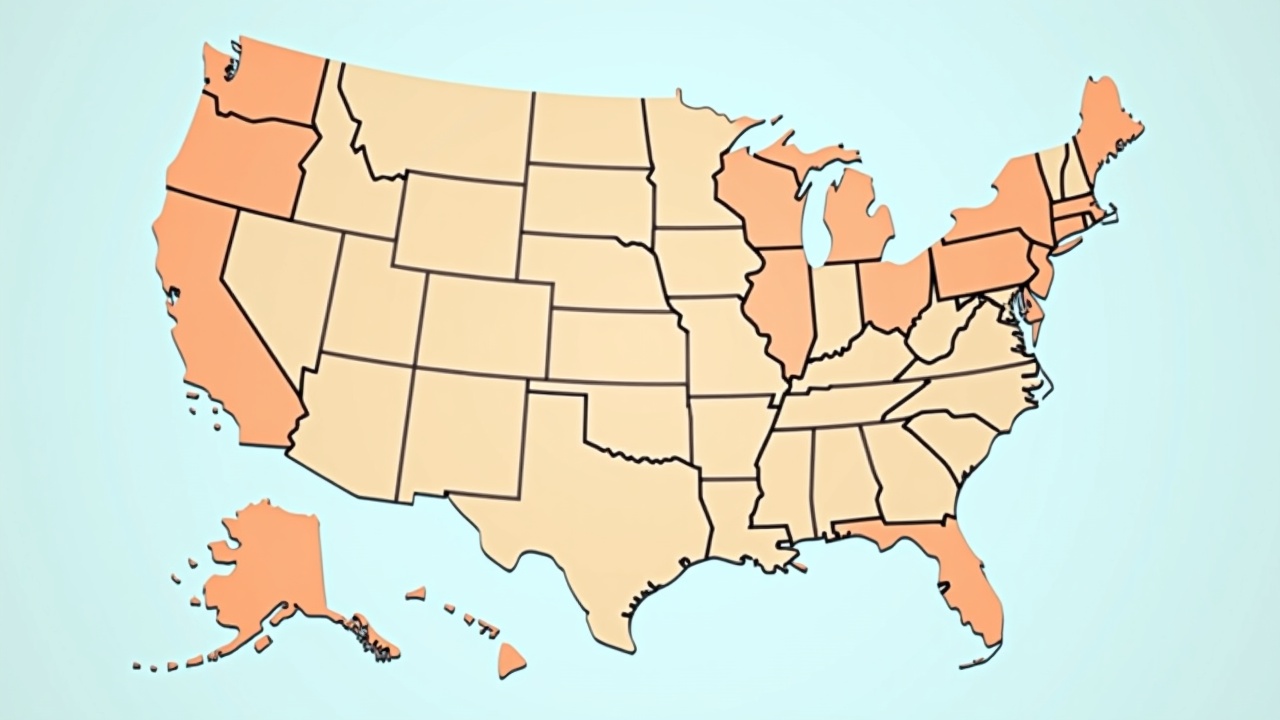
The five most expensive states and the five cheapest, side by side. Same 18 years, same kid.
| Rank | Most Expensive (18-yr total) | Least Expensive (18-yr total) |
|---|---|---|
| 1 | Hawaii — $412,661 | New Hampshire — $201,963 |
| 2 | Alaska — $365,047 | South Carolina — $204,213 |
| 18-year totals (LendingTree 2026) |
| Rank | Most Expensive | Least Expensive |
|---|---|---|
| 1 | Hawaii — $412,661 | New Hampshire — $201,963 |
| 2 | Alaska — $365,047 | South Carolina — $204,213 |
| 3 | Maryland — $326,360 | District of Columbia — $202,115 |
Annual operating cost for one preschooler in licensed care (SmartAsset 2025)
| Rank | Most Expensive | Least Expensive |
|---|---|---|
| 1 | Massachusetts — $44,221/yr | Mississippi — $19,178/yr |
| 2 | Connecticut — $41,808/yr | Alabama — $20,550/yr |
| 3 | Vermont — $38,272/yr | Kentucky — $20,758/yr |
Sources: LendingTree 2026 (18-year totals), SmartAsset 2025 (annual operating costs). The District of Columbia ($202,115) is reported separately as a non-state federal district.
The most expensive states share three traits: limited licensed child care supply, high housing costs, and elevated grocery and healthcare prices. Hawaii pays for geographic isolation; Alaska for both isolation and short daylight; Maryland and Massachusetts for proximity to high-cost metro labor markets.
Recommended reading: Limited
The cheapest list is more mixed. New Hampshire's drop is partly a normalization story — child care availability rebounded sharply after a tight 2024. Mississippi, Alabama, and South Carolina earn their place the conventional way: low housing costs, low cost of child care, low state taxes.
One caveat the cost map doesn't show: income. Massachusetts requires $124,842 in household income to comfortably absorb child costs; Mississippi requires roughly $54,000, per SmartAsset. Each state's cost-of-child-to-median-income ratio is closer than the raw dollar figures suggest. If you're earning Boston wages in Boston, you may net out roughly the same as a Jackson family earning Jackson wages.
Explore by topic
Frequently Asked Questions
How does 3.7% inflation specifically impact long-term child-rearing budgets?
At 3.7% inflation, costs roughly double every 19 years. A child born in 2026 who consumes $20,000/year today will face costs near $36,000/year by their senior year of high school in 2044, even if inflation cools to a stable 3%. Budget on the assumption of 3–4% annual cost growth, not flat, and review every January.
Why are childcare costs in California 42% higher than the national average?
The drivers are licensing requirements (California's child-to-staff ratios are among the strictest), labor costs (a $16+/hour minimum wage pushes up center pricing), and real estate (commercial rent in major California metros runs 2–3x the national average). Licensed infant care in San Francisco often exceeds $24,000/year — close to Washington, D.C., which tops out at $24,243/year, per World Population Review.
Can high-yield savings accounts (4.45% APY) outpace inflation for education funds?
For short-term savings (1–5 years), yes — a 4.45% APY beats the current 3.7% CPI by 75 basis points in real terms. For 10–18 year horizons like an education fund, a diversified 529 plan invested in equity index funds historically returns 7–10% annually and is the better vehicle. Use high-yield savings for emergency funds and near-term child expenses; use 529 plans for long-term education savings.
How do recent job market trends (4.3% unemployment, BLS April 2026) affect family financial planning?
The 4.3% unemployment rate , per BLS, is up from the 3.4% cycle low in 2023 but still below the long-run average. Nonfarm payrolls added only +115,000 in April 2026 — a deceleration. Thicken emergency reserves: aim for 6 months of expenses rather than the standard 3, particularly if your industry has seen layoffs (tech, media). A weaker job market and a $303,418 child-rearing bill together argue for higher savings buffers, not lower.
Check your credit score for free — Kapitalwise
Check your credit score for free — Credit Karma
Sources
- LendingTree, "2026 Cost of Raising a Child Report," 2026 — lendingtree.com
- SmartAsset, "Cost to Raise a Child by State (2025 Study)," 2025 — smartasset.com
- Federal Reserve Economic Data (FRED), "Consumer Price Index for All Urban Consumers (CPIAUCSL)," April 2026 — fred.stlouisfed.org
- FRED, "10-Year Treasury Constant Maturity Rate (DGS10)," May 28, 2026 — fred.stlouisfed.org
- FRED, "30-Year Fixed Rate Mortgage Average (MORTGAGE30US)," May 28, 2026 — fred.stlouisfed.org
- FRED, "Federal Funds Effective Rate (FEDFUNDS)," April 2026 — fred.stlouisfed.org
- U.S. Bureau of Labor Statistics, "Employment Situation Summary" and "Consumer Price Index," April 2026 — bls.gov
- Internal Revenue Service, "2026 Child Tax Credit guidance," 2026 — irs.gov
- Peterson-KFF Health System Tracker, "Health Costs Associated with Pregnancy, Childbirth, and Postpartum Care," 2024 — healthsystemtracker.org
- HSA for America, "2026 ACA Out-of-Pocket Maximums," 2026 — hsaforamerica.com
- Yahoo Finance, "S&P 500 Index (^GSPC)," May 30, 2026 — finance.yahoo.com
- U.S. Department of Agriculture, "Expenditures on Children by Families," 2017 — usda.gov
- Hawaii Association of Realtors, "Statewide Single-Family Median Home Price, Q1 2026" — hawaiirealtors.com
- World Population Review, "Child Care Costs by State 2025," 2025 — worldpopulationreview.com
- U.S. Securities and Exchange Commission, "Investor.gov guidance on historical equity returns" — sec.gov
- Brookings Institution, "The Cost of Raising a Child," 2024 — brookings.edu
Bottom Line
The $303,418 number is intimidating in the abstract and tractable in practice. Open a 529 plan this week — five minutes online, a $200/month auto-transfer — and a third of the bill is already on autopilot. Add a high-yield savings account for the emergency fund, and the headline figure stops looking like an emergency.
Subscribe to The Canopy Brief for weekly insights on building a richer life.
The Canopy Brief
One financial insight. One career move. One tool worth knowing. Every Monday. 5 minutes. No fluff.
Free. No spam. Unsubscribe anytime.
Canopy Picks
Products we've vetted and recommend. We may earn a commission at no extra cost to you.
-
The Psychology of Money
Morgan Housel's timeless guide to how people actually think about money. -
The Simple Path to Wealth
JL Collins' road map to financial independence through index investing. -
You Need a Budget
The system behind YNAB — give every dollar a job. -
Credit Karma
Free credit score monitoring and personalized recommendations. -
Kapitalwise
Get matched with a vetted financial advisor in minutes.
Found an error? At Canopy Press, accuracy comes first. If you spot a claim that needs checking, let us know at [email protected] — we'll verify and correct it immediately.
Found an error? At Canopy Press, accuracy comes first. If you spot a claim that needs checking, let us know at [email protected] — we'll verify and correct it immediately.
Sources
- FRED - 10-Year Treasury Yield
- FRED - 30-Year Fixed Mortgage Rate
- FRED - Federal Funds Effective Rate
- FRED - Consumer Price Index (CPI)
- FRED - Unemployment Rate
- Yahoo Finance - S&P 500
- Yahoo Finance - 10-Year Treasury Yield (Market)
- Yahoo Finance - CBOE Volatility Index (VIX)
- Yahoo Finance - US Dollar Index
- Yahoo Finance - Gold Price (per oz)