
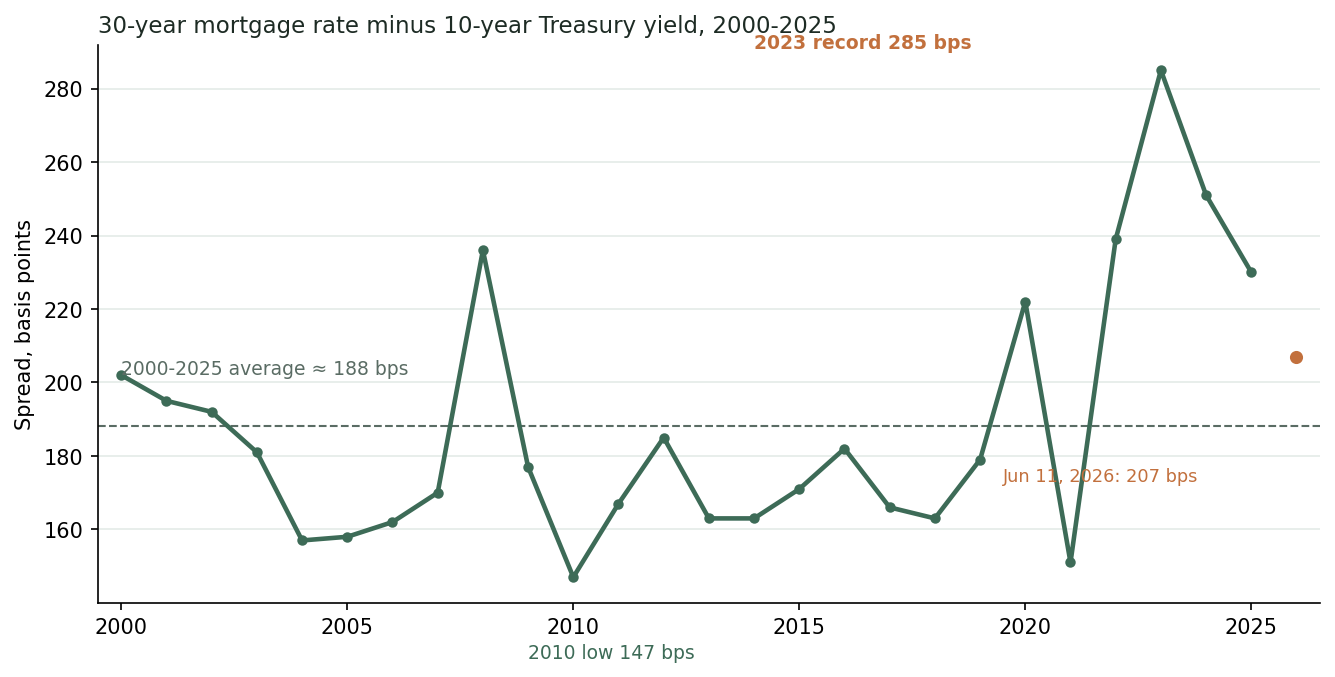
A 30-year mortgage rate is built from two parts: the yield on the 10-year Treasury, plus a spread the mortgage market charges on top. Across 2000–2025 that spread averaged about 188 basis points. It blew out to a 285-bps annual average in 2023 — the widest in our 2000–2025 record — and has narrowed since. As of the week of June 11, 2026, the 30-year fixed (6.52%) sat 207 bps over the 10-year Treasury (4.45%); the 2026 year-to-date average is 195 bps. Both still sit above the long-run norm, but far below the 2023 peak. For anyone waiting on rates, that is the overlooked part: with Treasury yields range-bound, it has been the spread normalizing — not the Fed — doing the work.
Why is there a spread at all? A 10-year Treasury is the risk-free benchmark; a 30-year mortgage is not. Investors who buy mortgage bonds price in the extra duration, the borrower's option to prepay or refinance, and servicing and credit costs — so the mortgage rate sits structurally above the Treasury, essentially never below it. What moves the spread within that floor — investor demand for mortgage bonds, prepayment expectations, the level of interest-rate volatility — is the market's to price. The series below shows the what and the when; it does not, on its own, establish the why.

The numbers
In 2000 the 30-year fixed averaged 8.1% and the 10-year Treasury 6.0% — a 202-basis-point spread. The table tracks selected years; the full annual series is in the CSV. Across 2000–2025 the spread ranged from a low of 147 bps in 2010 to the 285-bps record in 2023, against a long-run average near 188.
| Year | 30-year fixed | 10-year Treasury | Spread (bps) |
|---|---|---|---|
| 2000 | 8.1% | 6.0% | 202 |
| 2010 | 4.7% | 3.2% | 147 |
| 2020 | 3.1% | 0.9% | 222 |
| 2021 | 3.0% | 1.5% | 151 |
| 2022 | 5.3% | 3.0% | 239 |
| 2023 | 6.8% | 4.0% | 285 |
| 2024 | 6.7% | 4.2% | 251 |
| 2025 | 6.6% | 4.3% | 230 |
| 2026 (YTD) | 6.3% | 4.3% | 195 |
2026 is a partial year (averages through the week of June 11, 2026). The single most recent same-date reading — 30-year fixed 6.52% versus 10-year Treasury 4.45% on June 11, 2026 — is a 207-bps spread; the 195-bps figure is the 2026 year-to-date average. Both sit above the ~188-bps long-run norm.
The 2021–2023 whiplash
The swing is the vivid core of the story. In 2021 the spread averaged just 151 bps — near its lowest in the whole series — with mortgages around 3% and the 10-year near 1.5%. It then widened to 239 bps in 2022 and a record 285 bps in 2023: a +134-bps move in two years, even though the 10-year Treasury rose far less than the mortgage rate did. By 2024 (251) and 2025 (230) it had begun to retrace, and the latest readings — 207 bps on June 11, 2026, and a 195-bps year-to-date average — bring it within sight of the long-run norm. A borrower who watched only the Fed missed where the action actually was: in the spread.
How we built this
Every figure is a calendar-year mean of the underlying federal series: the 30-year fixed from the Freddie Mac Primary Mortgage Market Survey via FRED (MORTGAGE30US; weekly observations) and the 10-year Treasury from the FRED constant-maturity series (DGS10; daily observations). The spread is simply MORTGAGE30US minus DGS10, in basis points. The single latest reading pairs both series on the same date — the week of June 11, 2026 — so it is a like-for-like comparison, not a Thursday mortgage rate minus a different day's Treasury. There is no modeling or imputation, just arithmetic on published values.
Because the annual figures are means, they smooth over how far rates and the spread swung inside any single year; 2022 is the clearest case, when the spread moved sharply across the year as mortgage rates roughly doubled. The 2026 figures are partial-year and labeled as such.
"Record" and "widest" here mean within this 2000–2025 series of annual averages. Intra-year weekly spreads can run higher or lower than the annual mean, and years before 2000 are outside this dataset.
These are national aggregate series. The PMMS mortgage rate is an average offered contract rate to prime, conforming borrowers — not the effective rate on existing mortgages (most locked in far lower), and excluding points, fees, and non-conforming pricing. DGS10 is the 10-year Treasury constant-maturity yield, the standard risk-free benchmark; the mortgage-minus-Treasury spread is a market convention, not a single quoted product.
This analysis describes the spread's level and direction — the what and the when. It does not attribute the 2022–2023 widening to any single cause; the drivers economists cite (mortgage-bond demand, prepayment risk, interest-rate volatility) are interpretation, and these two series do not by themselves establish them.
FRED series are revised over time as source agencies update them. The figures here reflect the specific vintage we fetched and pinned in our raw snapshot.
Confidence
High. Every number is direct arithmetic on two official FRED series — annual means of published weekly and daily observations, and a subtraction. The honest limits are interpretive, not computational: these are offered, national-aggregate rates, annual means smooth within-year volatility, and the series shows the spread's behavior without claiming its cause. Within those bounds, the mortgage-minus-Treasury spread is a reliable, reproducible measure of what sits on top of the risk-free rate to make a mortgage.
Sources
FRED — 30-Year Fixed Rate Mortgage Average in the United States (MORTGAGE30US); Market Yield on U.S. Treasury Securities at 10-Year Constant Maturity (DGS10). Canopy Press analysis; annual averages of weekly/daily observations, spread in basis points.