
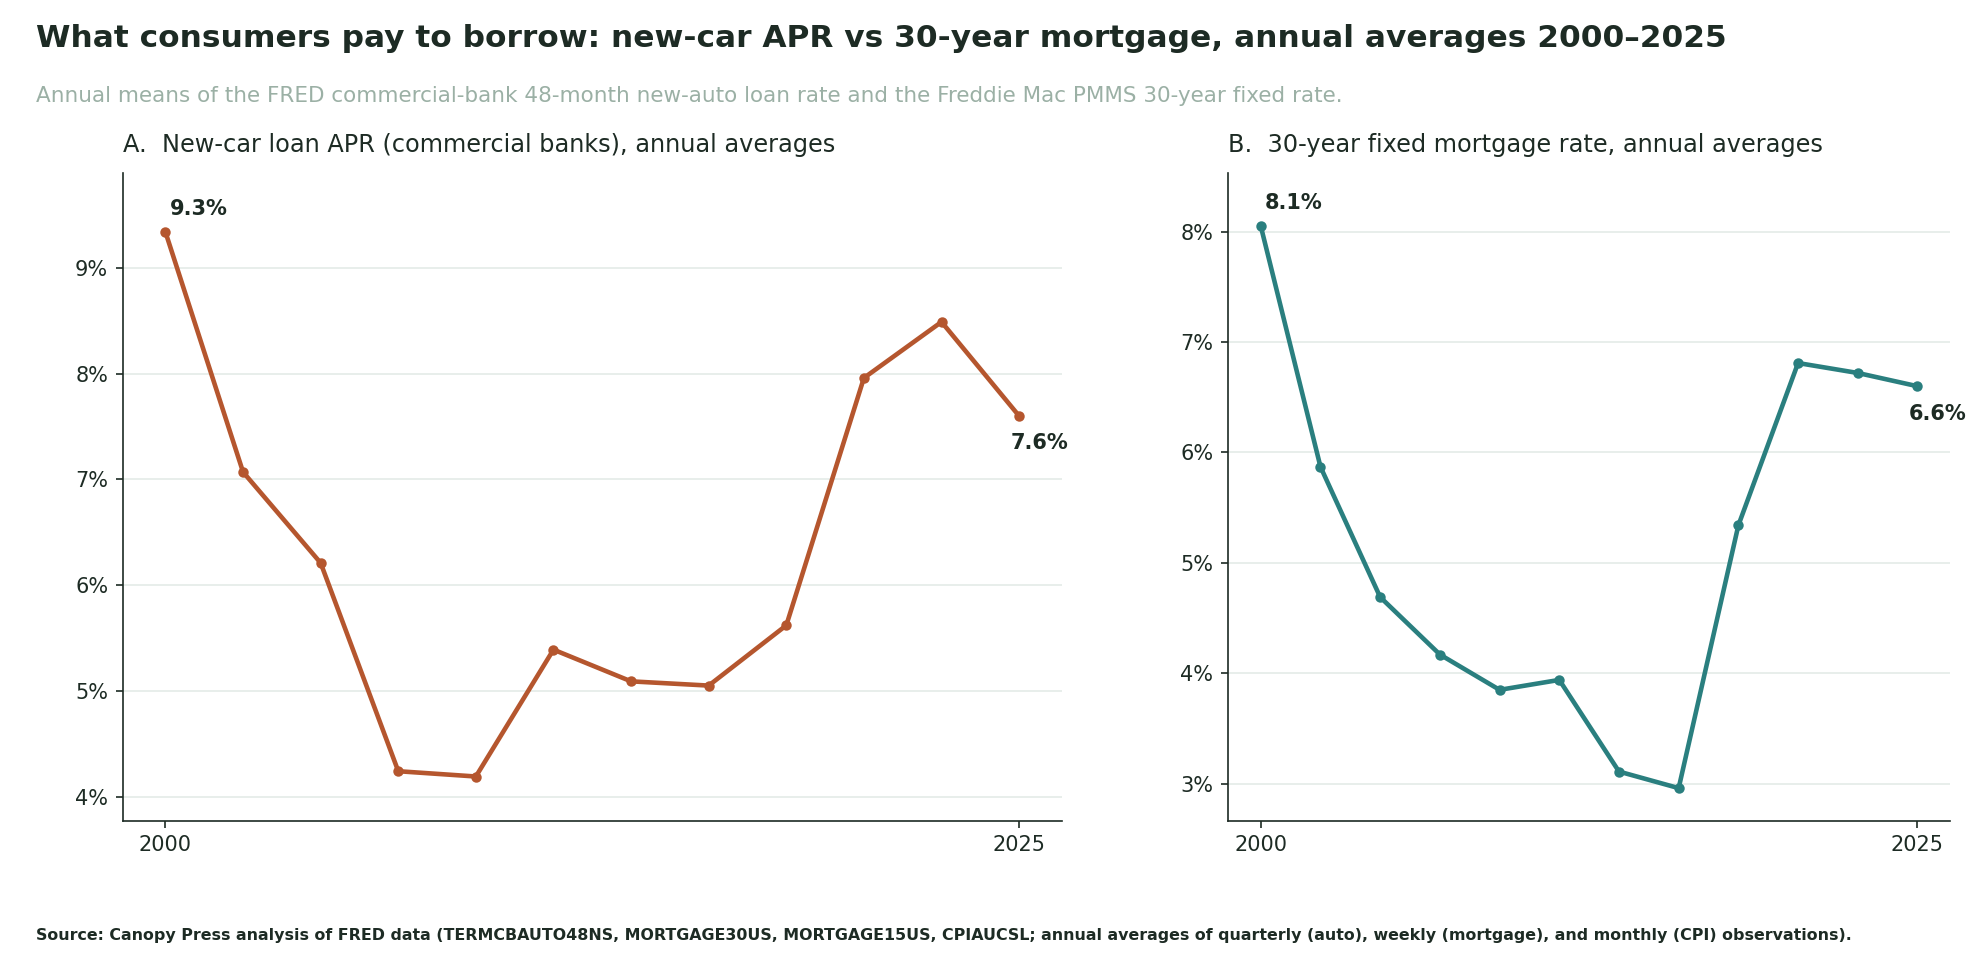
By interest rate, a mortgage is the cheapest big loan most consumers will ever take; a new-car loan is not. In 2025 the average 48-month new-car loan at commercial banks ran 7.6% APR, against 6.6% for a 30-year fixed mortgage — a gap of 100.0 basis points. The most recent readings put the auto rate at 7.4% (auto series as of 2026-02-01) versus 6.5% for the 30-year fixed (week of June 11, 2026). That spread, not the headline level, is the durable story: even when the Federal Reserve's rate cycle drags every borrowing cost up or down together, the secured-loan gap between cars and houses has its own shape.
Two things drive that gap. A mortgage is secured by an asset that usually holds or gains value, over 15-30 years; a car is secured by an asset that loses value the moment it leaves the lot, over four. Lenders price that difference into the APR. Below, we track both rates as annual averages back to 2000, with CPI inflation alongside so you can see when borrowing was cheap in real terms and when it only looked cheap.

The numbers, side by side
In 2000 the new-car APR averaged 9.3% and the 30-year fixed 8.1% — a 129.0-basis-point gap. The table below tracks selected years so you can see how that spread moved through the easy-money 2010s and the 2022-2023 tightening cycle. The gap was widest in 2021 at 209.0 basis points, when pandemic-era mortgages had bottomed near 3.0% while auto rates held above 5%; across the full span it has ranged from as little as 7.0 basis points in 2014 to that 2021 peak, and in 2022 it compressed from the peak to 28.0 basis points as mortgage rates spiked toward auto.
| Year | New-car APR (48-mo) | 30-year fixed | 15-year fixed | Auto − 30yr (bps) | CPI inflation |
|---|---|---|---|---|---|
| 2000 | 9.3% | 8.1% | 7.7% | 129.0 | 3.4% |
| 2010 | 6.2% | 4.7% | 4.1% | 152.0 | 1.6% |
| 2014 | 4.2% | 4.2% | 3.3% | 7.0 | 1.6% |
| 2020 | 5.1% | 3.1% | 2.6% | 198.0 | 1.3% |
| 2021 | 5.0% | 3.0% | 2.3% | 209.0 | 4.7% |
| 2022 | 5.6% | 5.3% | 4.6% | 28.0 | 8.0% |
| 2024 | 8.5% | 6.7% | 6.0% | 177.0 | 3.0% |
| 2025 | 7.6% | 6.6% | 5.8% | 100.0 | 2.6% |
How we built this
Every figure is a calendar-year mean of the underlying federal series: the new-car APR from the FRED commercial-bank series TERMCBAUTO48NS (quarterly observations, reported in arrears — Feb/May/Aug/Nov; latest February 2026), the 30- and 15-year fixed rates from the Freddie Mac Primary Mortgage Market Survey (PMMS) via FRED (MORTGAGE30US, MORTGAGE15US; weekly observations), and inflation as the year-over-year change in CPI-U (CPIAUCSL). There is no modeling or imputation — just arithmetic on published values. Because these are annual means, they understate how far rates swung inside any single year; 2022, when mortgage rates roughly doubled between January and October, is the clearest example.
We did not include the 5/1 adjustable-rate mortgage series here: Freddie Mac discontinued it in November 2022, so it has no current reading and would turn any "today" comparison into an artifact. The 30- and 15-year fixed series remain live and are the right basis for a present-tense mortgage-vs-auto comparison.
These are national aggregate series only. They describe the borrowing-rate environment for the country as a whole — they cannot stand in for what a particular borrower, age group, or income tier actually pays, and we make no by-cohort claim from them.
TERMCBAUTO48NS is specifically the commercial-bank 48-month NEW-auto loan rate. It excludes captive (manufacturer) finance arms — where many 0%-style promotional deals live — as well as used-car loans and other terms, and it is not seasonally adjusted. Read it as a rate-environment benchmark, not the rate any one buyer was quoted.
PMMS mortgage rates are average OFFERED contract rates to prime, conforming borrowers. They are not the effective rate paid on the outstanding stock of existing mortgages (most of which were locked in far lower), and they exclude variation in points and fees as well as non-conforming pricing — jumbo, FHA, and VA loans.
FRED series are revised over time as source agencies update them. The figures here reflect the specific vintage we fetched and pinned in our raw snapshot, retrieved through a rate-limited backoff client so a mid-revision fetch can't introduce inconsistencies.
Confidence
High. Every number is direct arithmetic on official FRED series — annual means of published weekly, monthly, and quarterly observations, with no estimation step. The honest limits are interpretive, not computational: these are offered, national-aggregate rates, and annual means smooth over within-year volatility. Used within those bounds, the auto-vs-mortgage spread is a reliable, reproducible measure of what it costs consumers to borrow across product types.
Sources
FRED — Finance Rate on Consumer Installment Loans at Commercial Banks, New Autos 48-Month Loan (TERMCBAUTO48NS); 30-Year Fixed Rate Mortgage Average (MORTGAGE30US); 15-Year Fixed Rate Mortgage Average (MORTGAGE15US); Consumer Price Index for All Urban Consumers: All Items (CPIAUCSL). Canopy Press analysis; annual averages of monthly/weekly observations.