
Across the 30 states that use HealthCare.gov, the 2026 benchmark premium — the second-lowest-cost Silver plan that anchors every subsidy calculation — averages $1,099 a month in Wyoming for a 40-year-old, against $414 in New Hampshire: a 2.65× gap, or $8,222 a year for the same benchmark tier. Every figure is computed from CMS's plan-level landscape files — the table and county-level data are downloadable below.
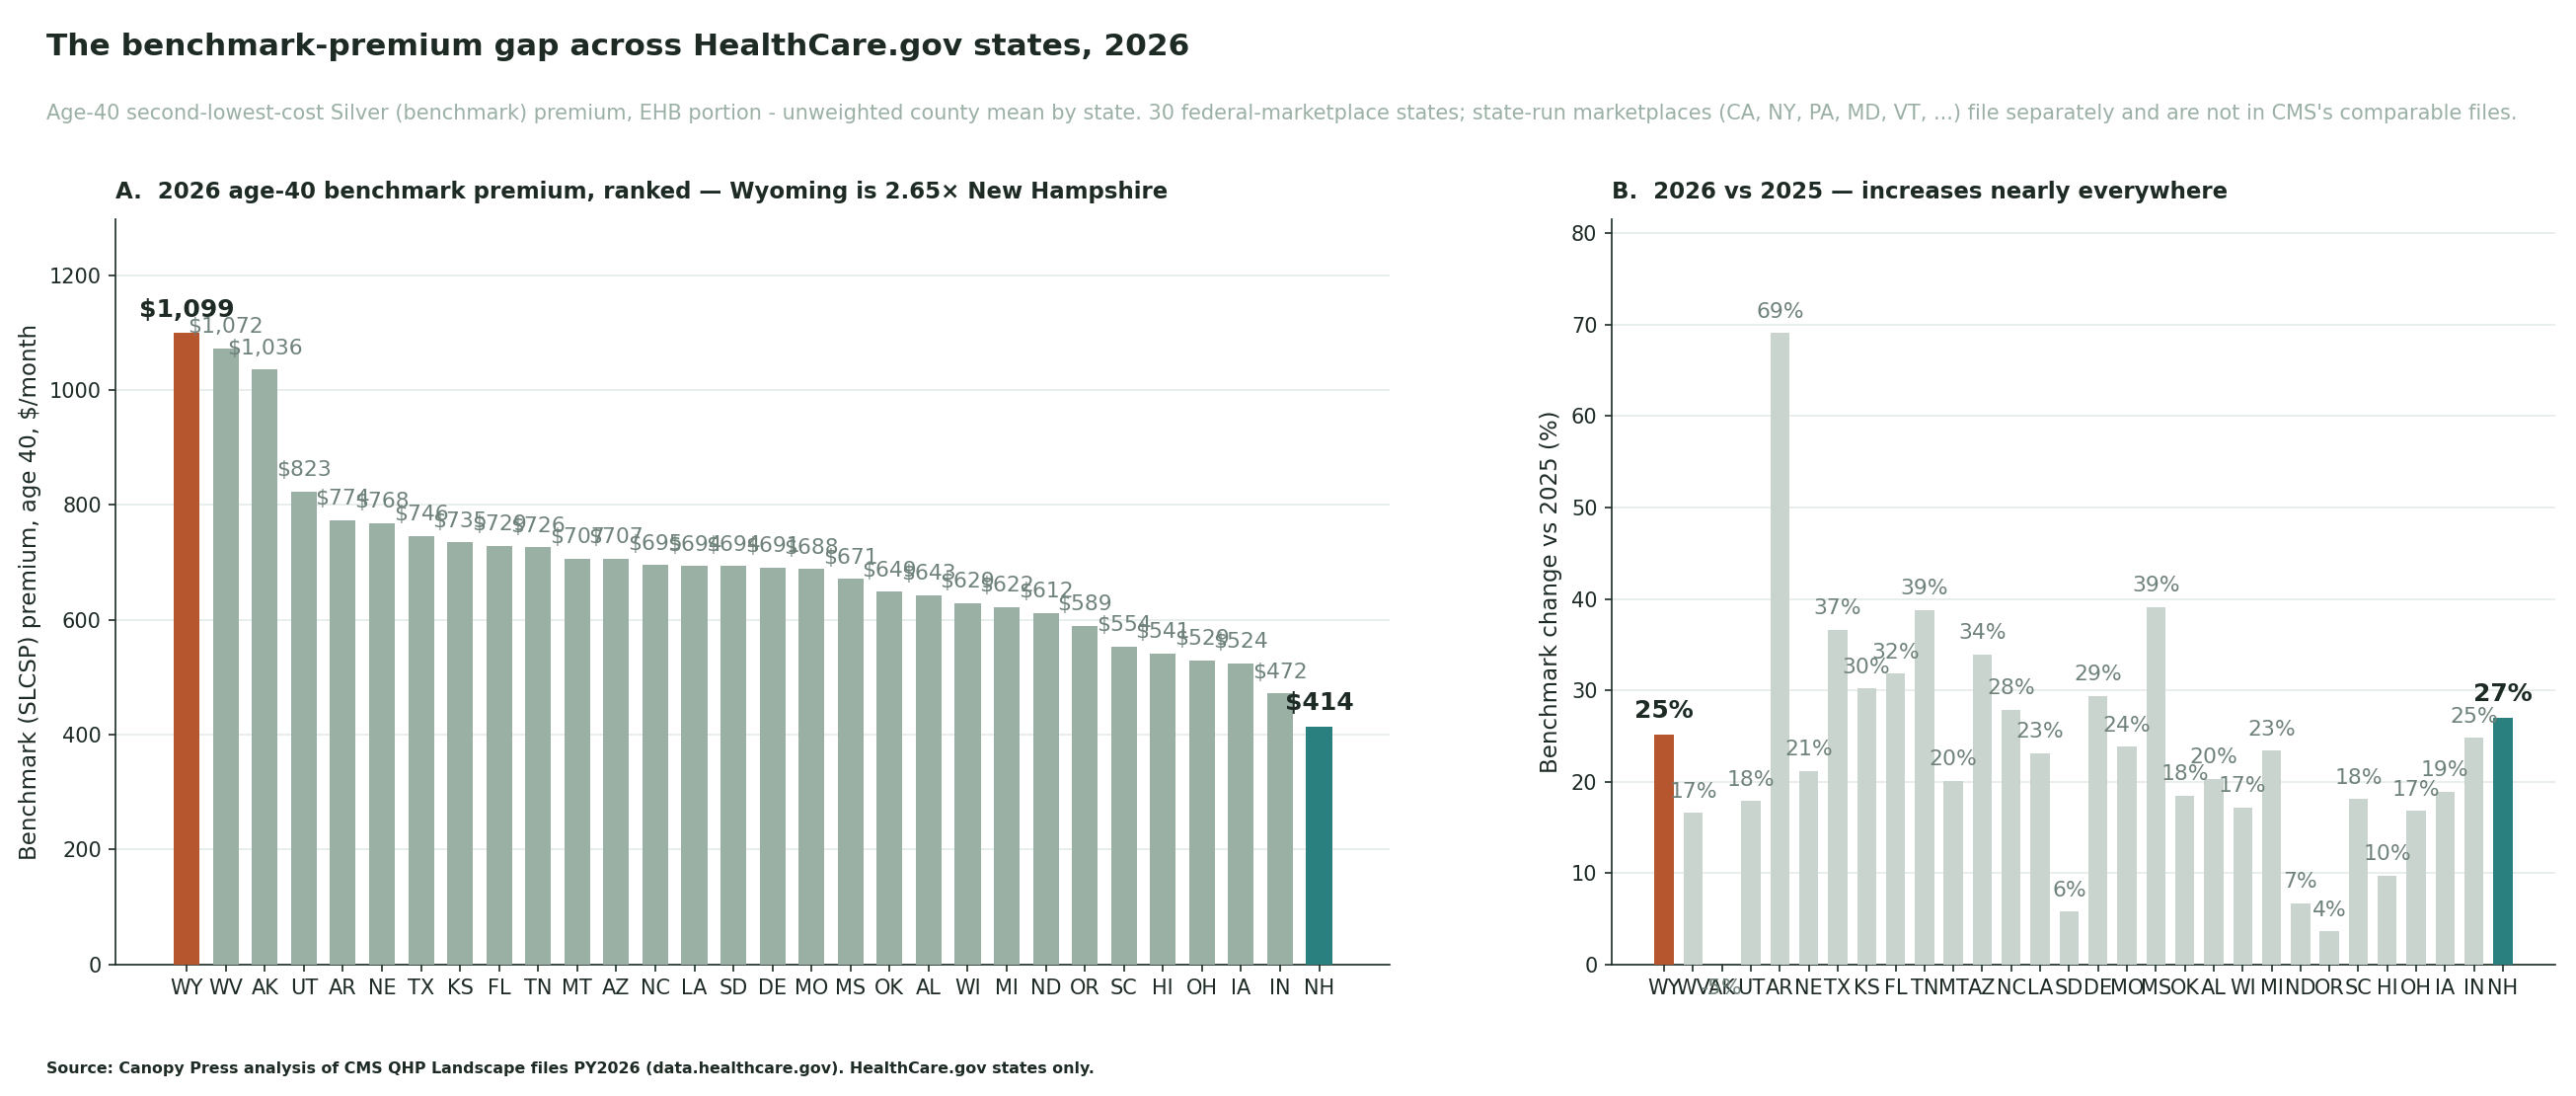

The ranked table — all 30 HealthCare.gov states
| State | 2026 benchmark, age 40 (mo.) | 2025 (mo.) | YoY | Counties |
|---|---|---|---|---|
| WY | $1,099 | $878 | 25.2% | 23 |
| WV | $1,072 | $919 | 16.6% | 55 |
| AK | $1,036 | $1,089 | -4.9% | 30 |
| UT | $823 | $698 | 17.9% | 29 |
| AR | $774 | $458 | 69.1% | 75 |
| NE | $768 | $634 | 21.2% | 93 |
| TX | $746 | $546 | 36.6% | 254 |
| KS | $735 | $564 | 30.2% | 105 |
| FL | $729 | $553 | 31.8% | 67 |
| TN | $726 | $523 | 38.8% | 95 |
| MT | $707 | $589 | 20.1% | 56 |
| AZ | $707 | $528 | 33.9% | 15 |
| NC | $695 | $544 | 27.9% | 100 |
| LA | $694 | $564 | 23.1% | 64 |
| SD | $694 | $655 | 5.8% | 66 |
| DE | $691 | $534 | 29.4% | 3 |
| MO | $688 | $556 | 23.8% | 115 |
| MS | $671 | $483 | 39.1% | 82 |
| OK | $649 | $548 | 18.5% | 77 |
| AL | $643 | $535 | 20.3% | 67 |
| WI | $629 | $537 | 17.2% | 72 |
| MI | $622 | $504 | 23.4% | 83 |
| ND | $612 | $574 | 6.7% | 53 |
| OR | $589 | $569 | 3.6% | 36 |
| SC | $554 | $469 | 18.1% | 46 |
| HI | $541 | $493 | 9.7% | 5 |
| OH | $529 | $453 | 16.8% | 88 |
| IA | $524 | $441 | 18.9% | 99 |
| IN | $472 | $378 | 24.8% | 92 |
| NH | $414 | $326 | 27.0% | 10 |
Why there is no clean national version of this number
These 30 states use the federal marketplace, so CMS publishes their plan-level prices in one comparable file. The other 21 jurisdictions — including California, New York, Pennsylvania, Maryland and Vermont — run their own marketplaces and file rates separately with state regulators, in formats that don't reduce to a comparable benchmark table. That seam in the data is why no single primary source can rank all 51; any \"50-state\" premium comparison you see is an aggregator's assembly of mixed sources. This asset stays inside the seam on purpose: every number here reproduces from two CMS files.
What moved in 2026
Benchmark premiums rose sharply across the federal marketplace for 2026: the county-level year-over-year change averages 25.9% (median 24.3%) across 2055 counties. CMS's own enrollment-weighted figure is roughly 30% — the difference is weighting, not disagreement: heavily-enrolled counties saw larger increases. Note that the benchmark is a moving target by design — the second-lowest Silver plan can be a different plan each year, so year-over-year movement reflects both price changes and plan entry/exit.
Methodology
The metric. For every county in the CMS QHP Landscape Individual Market Medical files (plan years 2025 and 2026), we rank Silver plans by the essential-health-benefits (EHB) portion of the age-40 single-nonsmoker premium and take the second-lowest — the SLCSP, the same benchmark HealthCare.gov uses for subsidy math (a county with a single Silver plan uses that plan). State values are unweighted means across counties; CMS's published headline uses plan-selection weighting, which is why CMS reports ~30% where this method shows ~26%. Premiums are gross market prices: most enrollees receive tax credits and pay far less. Age-rating means a 60-year-old faces roughly twice these levels in most states. Full reproduction steps, source-file hashes and the county-level table are on the methodology page.
Transformed figures are Canopy Press's analysis of CMS QHP Landscape public files (data.healthcare.gov). Reuse permitted with attribution (CC BY 4.0). State CSV download.
Cite or reuse this data (CC BY 4.0 with attribution):
Canopy Press (2026). “The Benchmark-Premium Gap Across HealthCare.gov States, 2026.” https://canopy.press/research/benchmark-premium-gap-healthcare-gov-states-2026/
Journalists: data questions answered at [email protected]. New research lands first in The Canopy Brief (weekly, free).