
Medicare covers nearly every American over 65 — and yet households headed by someone 65 or older spend more of their own money on healthcare than any other age group: $7,799 in 2024, 12.7% of everything they spend, against the second-lowest income of any bracket ($67,462). The next-heaviest bracket, 55–64, puts 7.9% of its spending toward healthcare; 25-to-34-year-old households put 5.1%.
That is the inversion this page documents: healthcare is the one major budget category whose burden peaks after the population gains near-universal coverage. Coverage changes who pays some of the bill; it does not make the household's own bill small. The 65+ figure is real out-of-pocket reality — premiums the household itself pays, cost-sharing, drugs, and the dental, vision, and hearing care Medicare largely does not cover.
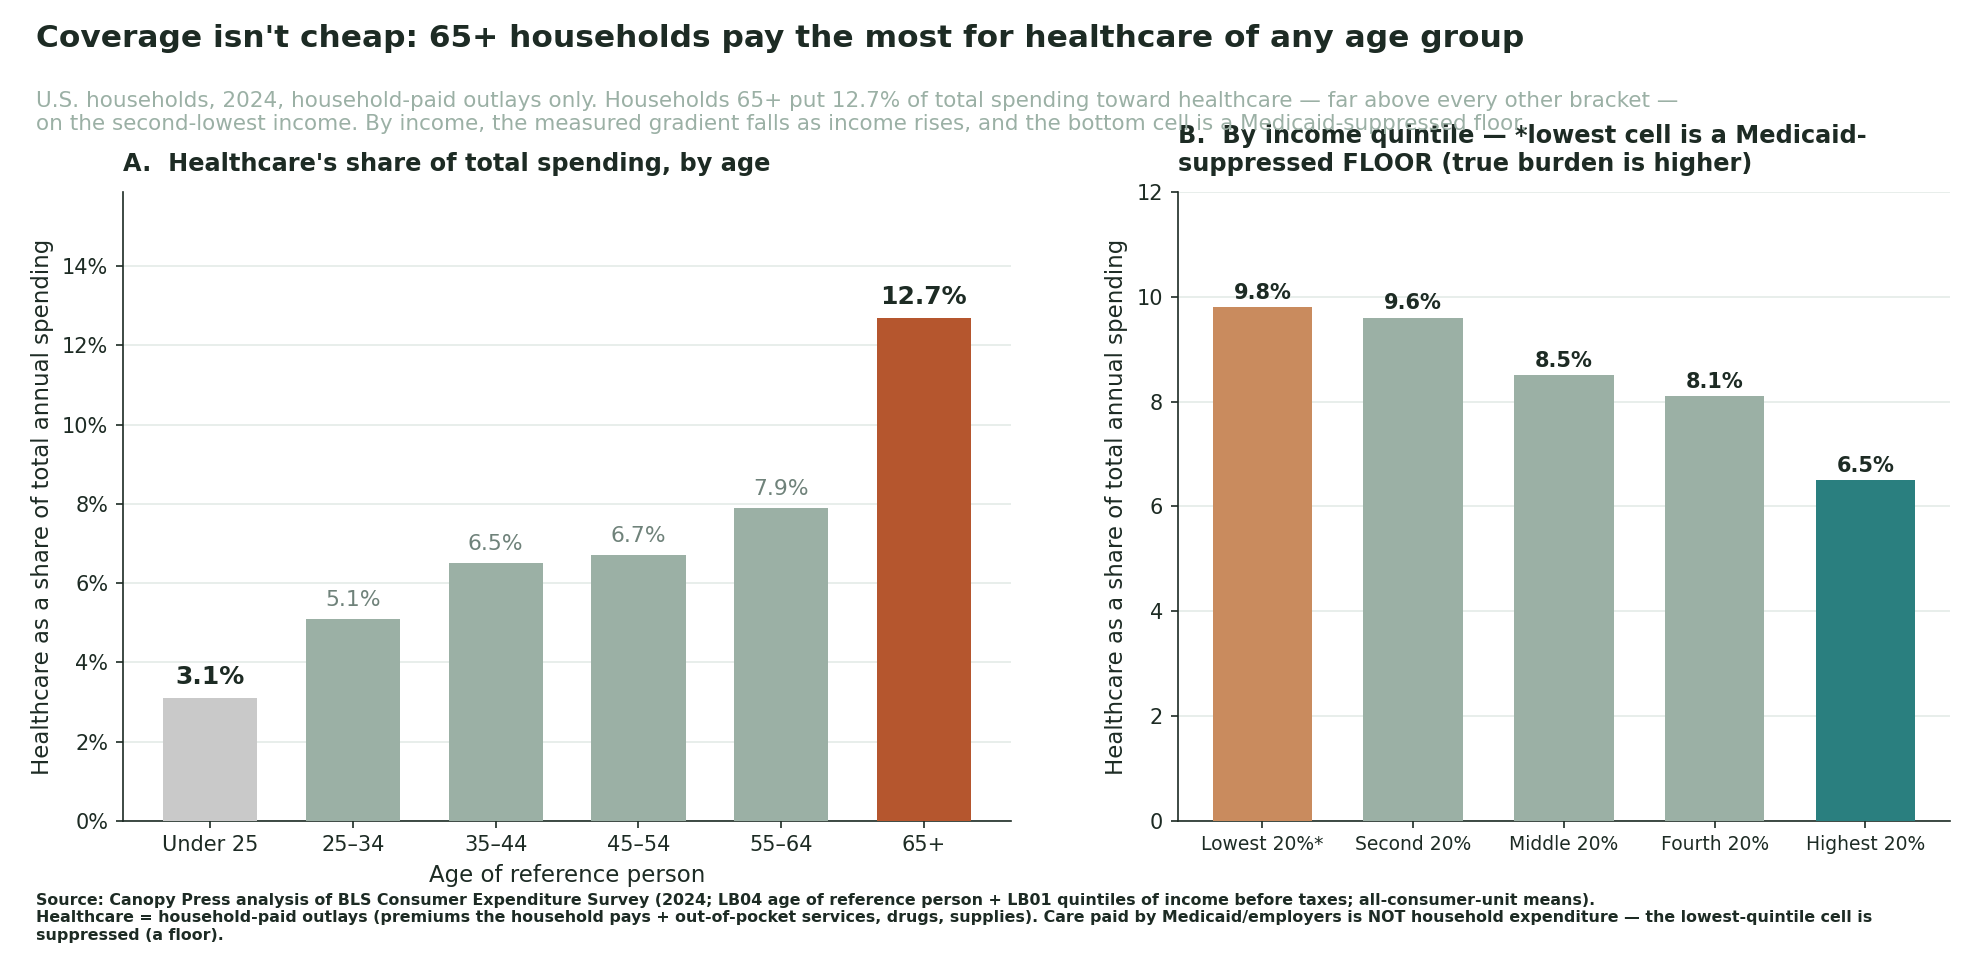

By age: the burden peaks after 65
| Age of reference person | Healthcare (household-paid, mean) | Share of total spending | Share of pre-tax income |
|---|---|---|---|
| Under 25 | $1,485 | 3.1% | 3.1% |
| 25–34 | $3,825 | 5.1% | 3.7% |
| 35–44 | $5,949 | 6.5% | 4.6% |
| 45–54 | $6,748 | 6.7% | 4.8% |
| 55–64 | $6,711 | 7.9% | 5.5% |
| 65+ | $7,799 | 12.7% | 11.6% |
BLS Consumer Expenditure Survey 2024, by age of reference person; all-consumer-unit means of household-paid outlays. The under-25 cell is thin and shown for completeness. The 65+ share of pre-tax income (11.6% — more than double any working-age bracket) is directional: retiree income is partly asset-drawdown-funded, so the share-of-spending column is the defensible measure.
The 65+ burden is not a one-year artifact. Household-paid healthcare dollars for 65+ households rose from $5,849 in 2014 to $7,799 in 2024 — up 33.0% — and their healthcare share of total spending has stayed between 12.7% and 14.0% for the full decade: never below 12.7%, which by itself exceeds every other bracket's 2024 share (the full series is Block 2 of the CSV).
By income: a gradient that is really a floor
| Income quintile | Healthcare (household-paid, mean) | Share of total spending | Share of reported income |
|---|---|---|---|
| Lowest 20% | $3,445 | 9.8% | 20.7% |
| Second 20% | $4,826 | 9.6% | 11.2% |
| Middle 20% | $5,676 | 8.5% | 7.6% |
| Fourth 20% | $7,247 | 8.1% | 6.0% |
| Highest 20% | $9,771 | 6.5% | 3.7% |
Read the lowest-quintile row as a floor, not the burden. CE measures only what the household itself pays. Care paid by Medicaid — whose enrollment is concentrated exactly in this quintile — never appears as household expenditure, so the measured $3,445 understates what low-income healthcare actually costs, and understates it disproportionately at the bottom of the income distribution. The 20.7% share of reported income is additionally non-literal (this quintile's spending exceeds its reported income — the same under-reporting caveat as our housing analysis).
With that floor stated, the measured pattern is still striking — in two directions at once. In dollars, household-paid healthcare rises with income: $3,445 for the lowest fifth to $9,771 for the highest, because higher-income households buy more coverage and more care with their own money. But as a share of their total spending, the gradient runs the other way: 9.8% at the bottom falling to 6.5% at the top. And because the bottom cell is Medicaid-suppressed, the true gradient is steeper than measured: the measured numbers hold even after government coverage absorbs much of the bottom quintile's cost. We do not claim healthcare is 'regressive' in the naive sense — we claim the measured share-of-spending gradient is a lower bound on the disparity.
Methodology
The metric. Healthcare = the BLS Consumer Expenditure Survey Healthcare category: outlays the consumer unit itself makes — health-insurance premiums the household pays, plus out-of-pocket medical services, drugs, and supplies — as the consumer-unit annual mean. The burden is that figure divided by (a) total average annual expenditures (the share-of-spending measure both panels use: numerator and denominator are both household-paid expenditure, immune to income-reporting artifacts) and (b) income before taxes (the caveated companion). No 2024 after-tax income vintage exists at these cuts, so the after-tax sensitivity is stated directionally: after-tax denominators would raise every share.
What CE healthcare is NOT. It is not total healthcare cost. Spending paid on the household's behalf — by Medicaid, by employers' premium contributions, or by Medicare's program side — is not household expenditure and is not in these figures. That is precisely why the lowest-quintile cell is presented as a floor, and why the 65+ figure is the honest headline: it is the bracket where the household's own bill is largest even with near-universal coverage (a small dual-eligible minority means even the 65+ cell is mildly suppressed).
Sources.
- BLS Consumer Expenditure Survey (LABSTAT), classification
LB04= age of reference person; itemsHEALTH,TOTALEXP,INCBEFTX, 2014–2024 annual. Classification verified against BLS's own API catalog titles and the published 2024 all-consumer-unit anchors (healthcare $6,197; total expenditures $78,535). - Same survey, classification
LB01= quintiles of income before taxes, 2024 — staged snapshot with a deterministic offline recompute (the quintile figures reproduce bit-for-bit from the pinned raw file).
Means, not medians; categories, not patients. All figures are all-consumer-unit means (insured and uninsured together); right-skew means they overstate the typical household. An all-household mean also blends how many households carry an expense with how much those households pay — so we make no per-person price or per-patient cost claim, and the decade rise in 65+ dollars is presented as a category mean, not a unit-cost trend.
Confidence. High for the 65+ inversion and both share-of-spending gradients — direct arithmetic on published federal survey means, regression-checked and recomputable offline. The cross-quintile comparison is explicitly a floor (Medicaid suppression). Share-of-income levels for the lowest two quintiles and 65+ are directional only.
Transformed figures are Canopy Press's analysis of the underlying federal data, not “BLS data.” Reuse permitted with attribution to Canopy Press (CC BY 4.0). Full underlying figures: CSV download.
Further reading from Canopy Press
Cite or reuse this data (CC BY 4.0 with attribution):
Canopy Press (2026). “Coverage isn't cheap: households 65+ pay the most for healthcare of any age group — out of their own pockets.” https://canopy.press/research/healthcare-cost-burden-by-age-income-2024/
Journalists: data questions answered at [email protected]. New research lands first in The Canopy Brief (weekly, free).