
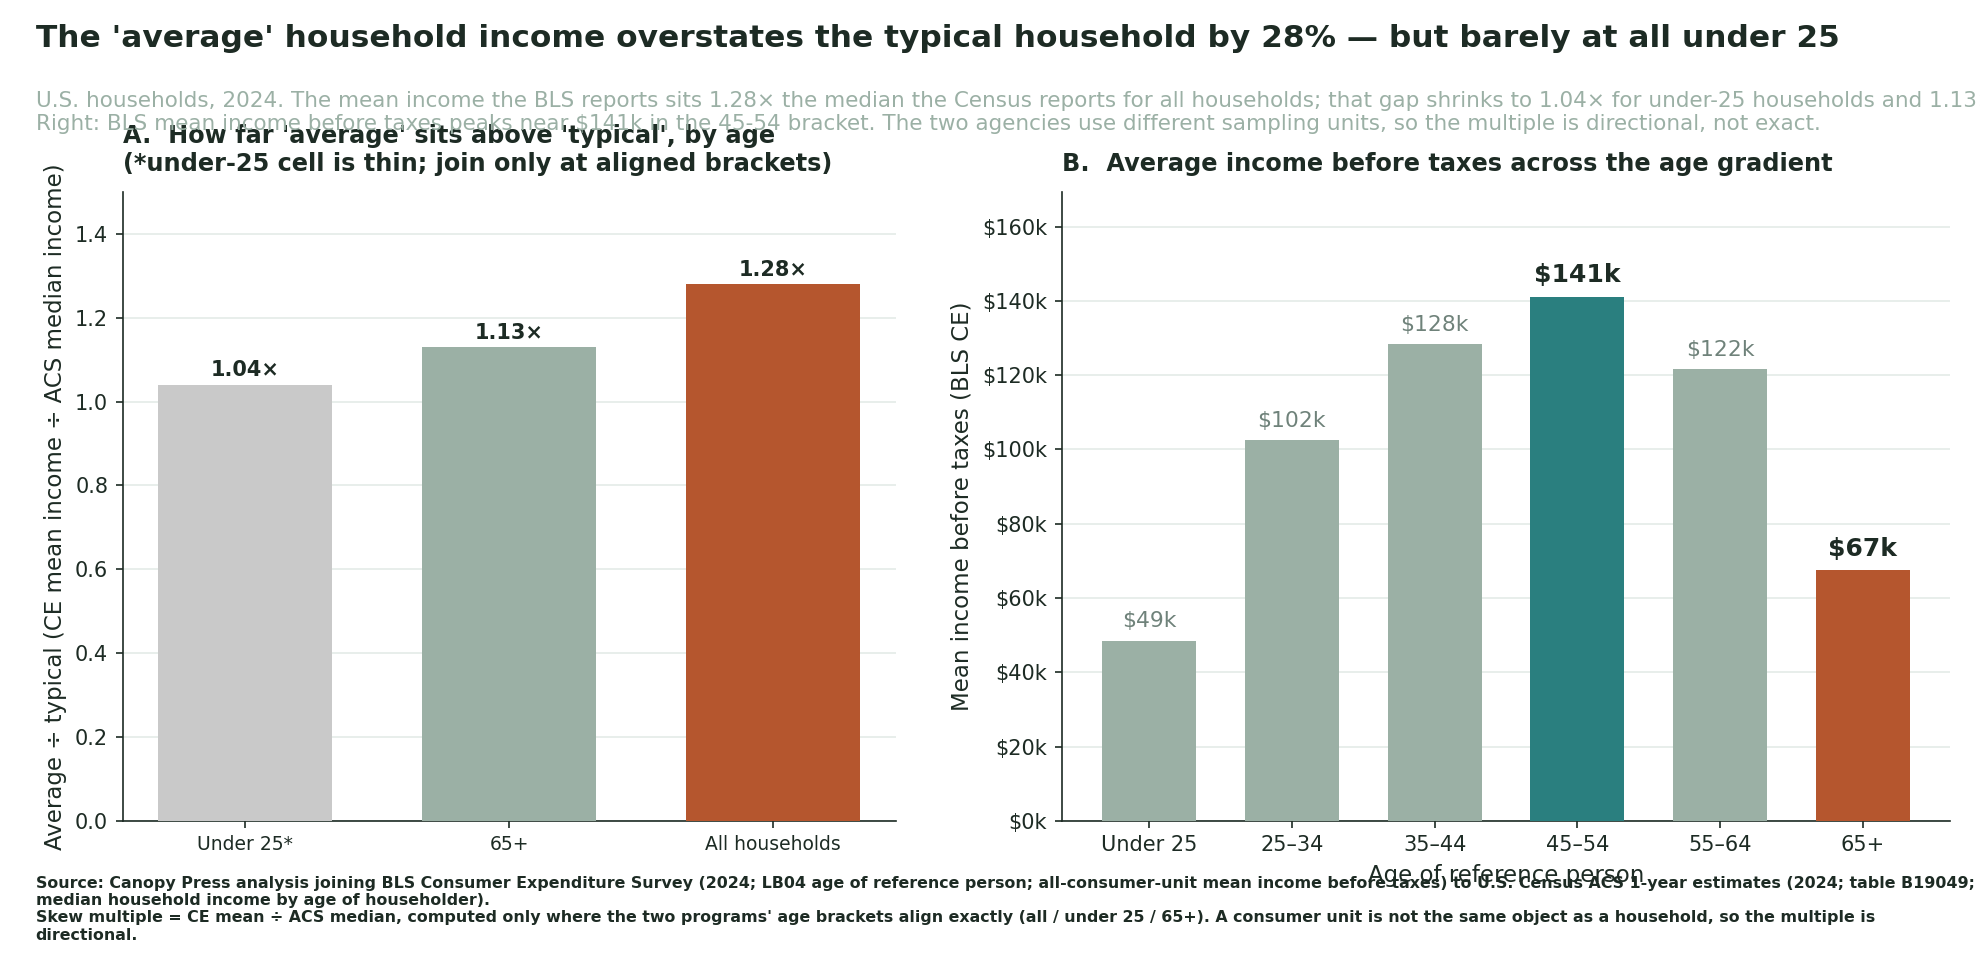
How much does a U.S. household earn? The honest answer starts with a question back: whose household, and measured how? Two federal programs both publish an answer by age, and they disagree in a revealing way. For all households in 2024, the U.S. Census Bureau's American Community Survey (ACS) puts the median — the typical household, with half earning more and half less — at $81,604. The Bureau of Labor Statistics (BLS), measuring the average instead, reports income before taxes of $104,207. That average — a BLS consumer-unit mean, not a household median — runs about 28% above the typical household; because the two programs count slightly different units, treat the exact multiple as directional. The gap moves with age, too: at the two age brackets where the programs' cuts align, the average overstates the typical household by just 4% under 25 and 13% at 65 and over — while the pooled all-ages gap is wider than either by-age bracket; the pooled figure also folds in prime-age brackets this join does not compute, so it cannot apportion the gap between age mix and within-age skew.
The short version
- The typical (median) household headed by someone 45-64 earned roughly $100,000 in 2024 (Census ACS coarse band, approximate — rounded, context only, not among the certified skew figures) — where the age curve appears to peak.
- BLS mean income before taxes peaks within the younger half of that span, at $141,121 for the 45-54 bracket (finer 10-year cuts than the coarse ACS 45-64 band), and falls to $67,462 at 65+.
- Across all households the average sits 1.28× the median — a 28% gap driven by right-skew, though part reflects the fact that BLS counts consumer units while Census counts households — so treat the exact multiple as directional.
- That skew is smallest for the youngest households (1.04×), whose incomes are compressed, and it is a same-year ratio, so inflation cancels out.

What the typical household actually earns, by age
Start with the median, because that is what most people mean by 'typical.' Census ACS table B19049 puts a household headed by someone under 25 at $46,651 in 2024, rising to roughly $92,000 for the 25-44 band and appearing to top out just above $100,000 for 45-64 — two coarse-bracket medians that each carry an ACS margin of error, so we show them rounded and approximate — context, not certified figures. It then steps down to $59,648 at 65 and over, largely because work income gives way to Social Security, pensions, and drawdowns.
The BLS average traces the same arch but higher and steeper. Mean income before taxes climbs from $48,514 under 25 to $141,121 in the 45-54 peak bracket, then falls to $67,462 at 65+. Over the full decade, the all-consumer-unit CE mean rose 56% in nominal terms (not adjusted for inflation).
Why 'average income' overstates the typical household
Income is right-skewed: a small number of very-high earners pull the average up, while the median stays anchored to the middle. That is why the mean always sits above the median. The useful part is the size of the gap, and it is not constant. Dividing the BLS mean by the Census median at each aligned bracket combines two familiar-but-different numbers into a ratio neither program publishes directly — a portable read on how misleading 'average income' is at a given age.
| Age bracket | Typical (Census ACS median) | Average (BLS CE mean, before tax) | Average overstates typical by | Skew multiple |
|---|---|---|---|---|
| All households | $81,604 | $104,207 | 28% | 1.28× |
| Under 25 | $46,651 | $48,514 | 4% | 1.04× |
| 65 and over | $59,648 | $67,462 | 13% | 1.13× |
The pattern is clean. Under-25 households show almost no gap (1.04×) because young incomes are bunched near the bottom with few outliers to pull the mean. At 65+ the multiple is 1.13×, and pooled across all ages it widens to 1.28× — wider than either of the two computed tail brackets. The pooled figure also folds in the prime-age brackets (25-64), for which this join computes no mean-to-median multiple; which effect dominates, income differences between age groups or skew within them, this join cannot say.
How we built this number
The skew multiple is a cross-source join: BLS Consumer Expenditure Survey mean income before taxes (classification LB04, all-consumer-unit means) divided by Census ACS median household income (table B19049), both for the same year. We compute it only at the three brackets whose age cuts align exactly — all households, under 25, and 65 and over — because the middle of the age range does not line up. Census reports a single 25-44 band and a single 45-64 band, while BLS splits those into four 10-year brackets, and no consumer-unit-weighted mean for the combined bands can be reconstructed from published means alone. The full BLS age gradient and the coarse Census medians appear side by side as context, but they are never joined cut-for-cut in the middle.
One caveat sits above the rest: the two series count different objects. BLS samples a 'consumer unit' identified by a 'reference person'; Census samples a 'household' identified by a 'householder.' These are close but not identical, so part of every mean-to-median gap reflects that definitional difference rather than skew alone. What survives that objection is the direction — the mean exceeds the median in every bracket, a guaranteed feature of right-skewed income — and the age ordering. The exact multiple is directional, not a precise measurement.
By construction, we are comparing a mean with a median: BLS publishes means, Census publishes medians, and for right-skewed income the mean sits above the median every time. That expected gap is the metric, not an error. Every BLS figure here is an all-consumer-unit mean across all household sizes, not a median, so it should not be read as what a middle household earns.
We use income before taxes throughout. The CE does publish an after-tax income concept, but no 2024 vintage exists at these age cuts — only a 2014 series — so any after-tax reading is directional: it would compress the BLS mean (the numerator of the multiple) and nudge the multiples, but we do not compute that here.
Finally, the survey grain. Every ACS estimate carries a margin of error, and 1-year estimates carry larger margins than 5-year estimates, so a single dollar level should be read alongside its margin. The under-25 bracket is a thin cell in both surveys; we show it, but its near-1.0 multiple is directional and never the headline.
Confidence
High for the direction and ordering: the average exceeds the median in every aligned bracket, and the gap is smallest for the young — both robust to the consumer-unit-versus-household difference. The exact multiple is directional because of that unit difference, and the middle-age join is deliberately not attempted because the two programs' brackets do not align there.
This is informational analysis of federal survey data, not financial advice.
Source (average income): U.S. Bureau of Labor Statistics, Consumer Expenditure Survey, 2014 & 2024, series CXUINCBEFTXLB04{01–07}M (mean income before taxes by age of reference person), bls.gov.
Source (typical income): U.S. Census Bureau, American Community Survey 1-year estimates, 2014 & 2024, table B19049 (median household income in the past 12 months by age of householder), census.gov.
Analysis, cross-source join, and mean-to-median skew multiple by Canopy Press. The multiple divides the BLS consumer-unit mean by the Census household median at aligned age brackets and is a same-year, dimensionless ratio.