
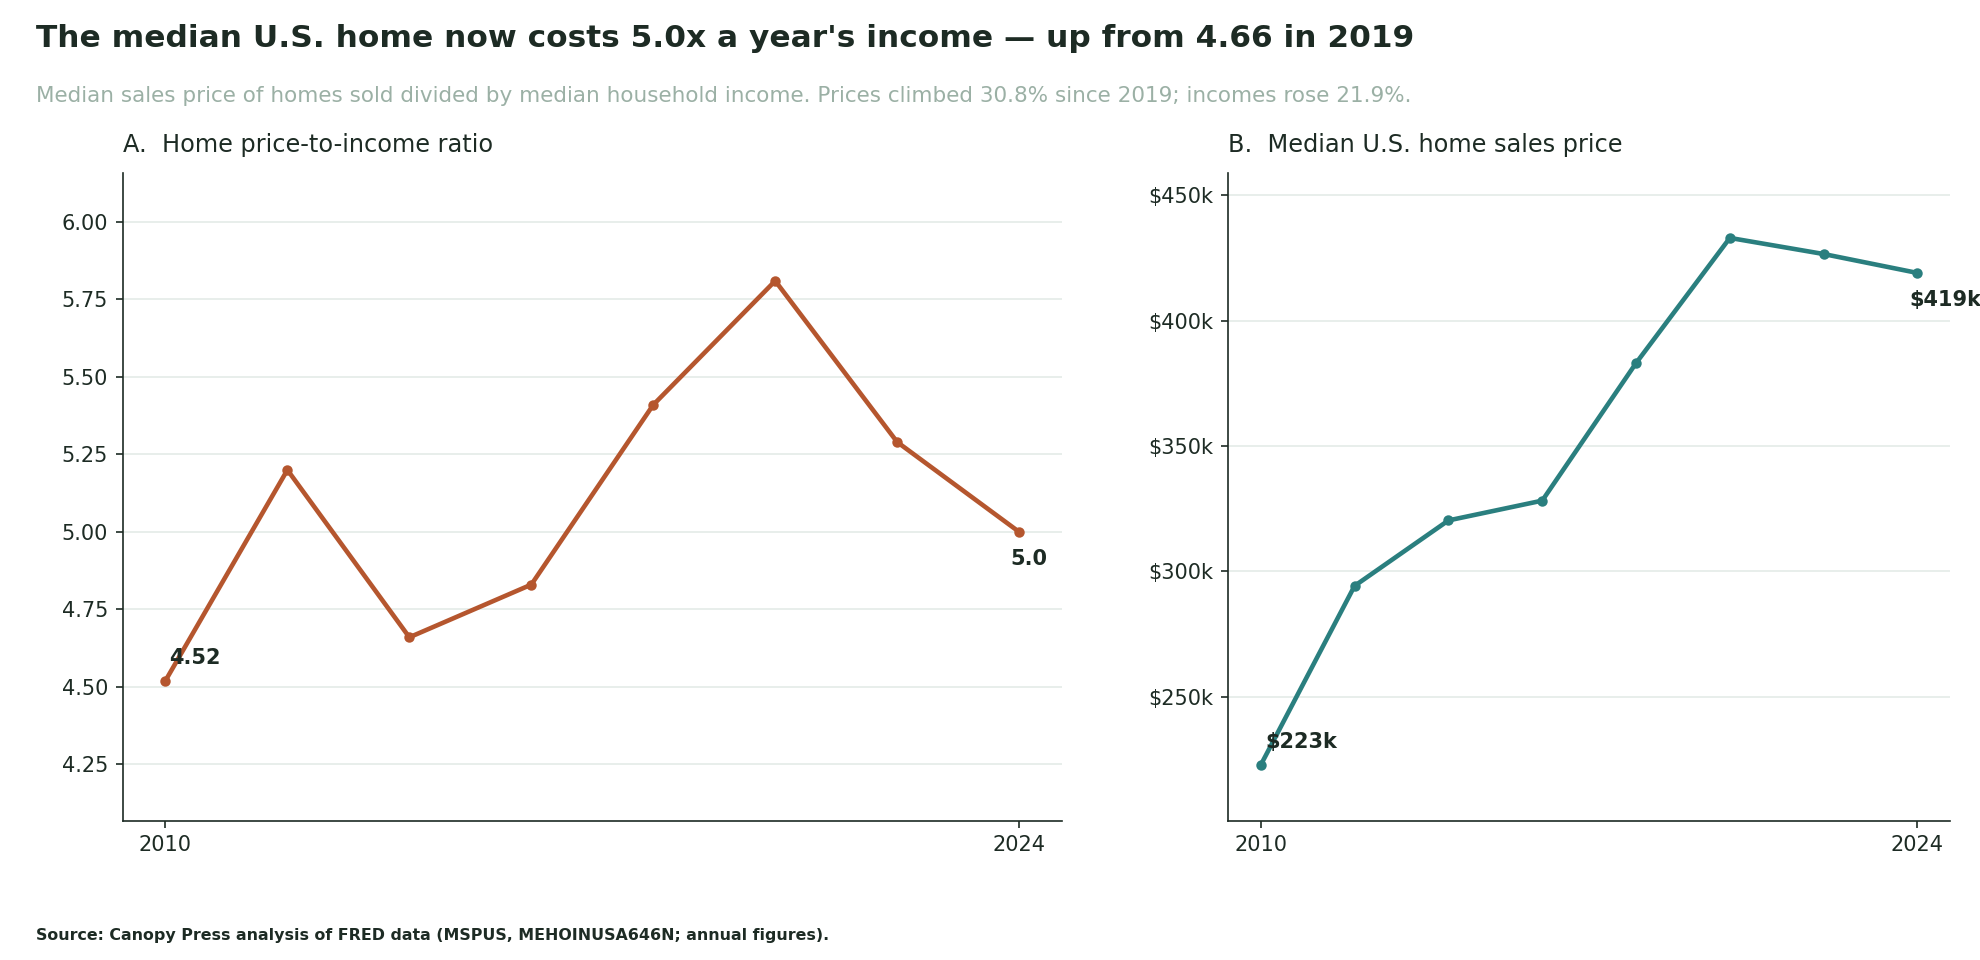
In 2019 the median American home sold for about 4.66 times the median household income. By 2024 that figure had climbed to 5.0, after peaking near 5.81 in 2022. Home prices rose 30.8% over that stretch while incomes rose only 21.9% — prices outpacing pay by nearly nine points of cumulative growth. The net effect: a home now costs noticeably more years of household income than it did in 2019. Those two growth rates aren't additive with the ratio, though: that roughly nine-point gap is an illustrative comparison of growth rates, not the amount the price-to-income ratio itself changed, which rose only about a third of a point (4.66 to 5.0).

The numbers
| Year | Median sales price | Median household income | Price-to-income ratio |
|---|---|---|---|
| 2010 | $222700 | $49280 | 4.52 |
| 2019 | $320250 | $68700 | 4.66 |
| 2020 | $328150 | $68010 | 4.83 |
| 2021 | $383000 | $70780 | 5.41 |
| 2022 | $432950 | $74580 | 5.81 |
| 2023 | $426525 | $80610 | 5.29 |
| 2024 | $418975 | $83730 | 5.0 |
The ratio tells a story that neither number tells alone. It rose from 4.66 in 2019 to a peak of 5.81 in 2022 as prices ran ahead of pay, then eased to 5.0 by 2024 — driven mostly by rising incomes but helped by a modest slip in prices from their 2022 peak, not by any return to genuinely affordable homes: even after slipping from the 2022 peak, the median price ($418,975 in 2024) remained 30.8% above its 2019 level ($320,250). That partial recovery is a genuine part of the picture — but it is not a return to affordable homes.
Why the ratio — and not the monthly payment
What this measures, and what it doesn't. This analysis divides the median sales price of homes sold — Federal Reserve Economic Data (FRED) series MSPUS — by median household income (FRED MEHOINUSA646N), both annual national figures. That captures only the price side of buying a home. The full monthly-payment burden also depends on mortgage rates and the down payment — neither of which is in this dataset. Because 30-year mortgage rates jumped from roughly 3% in 2020-2021 to roughly 6-8%, peaking near 7.8% in late 2023 (Freddie Mac's 30-year fixed-rate survey, FRED MORTGAGE30US), the actual monthly cost of financing a purchase rose by more than the price-to-income ratio alone implies. Read the ratio as a floor on the affordability squeeze, not the whole of it.
Median price of homes sold, not a constant-quality index. MSPUS is the median price of homes that actually changed hands each period — a transaction-mix measure. When the mix of what sells shifts (more high-end sales, fewer starter homes, or the reverse), the median moves even if no individual home changed price. It is not a repeat-sales, constant-quality index like the Federal Housing Finance Agency (FHFA) House Price Index, so treat single-year wiggles cautiously and lean on the multi-year trend.
National only. Both series are national aggregates with no regional, metro, or demographic detail. A household in a high-cost metro faces a price-to-income ratio far above 5.0, and one in a low-cost region far below it. These figures describe the country in aggregate, never a local market.
Revisions, survey error, and timing. Both FRED series are revised as new data arrives, and median household income is a survey estimate carrying sampling error — the figures here are pinned to the snapshot fetched for this build. Income is also a calendar-year figure that lags: 2024 is the latest reading available, so the ratio cannot be extended into 2025 even though the price series already has a 2025 value. That is why the trajectory here stops at 2024.
Underlying data: Federal Reserve Economic Data (FRED) series MSPUS (Median Sales Price of Houses Sold) and MEHOINUSA646N (Median Household Income in the United States). Ratios and growth rates are Canopy Press's analysis of that official data. Reuse permitted with attribution (CC BY 4.0). CSV download.