
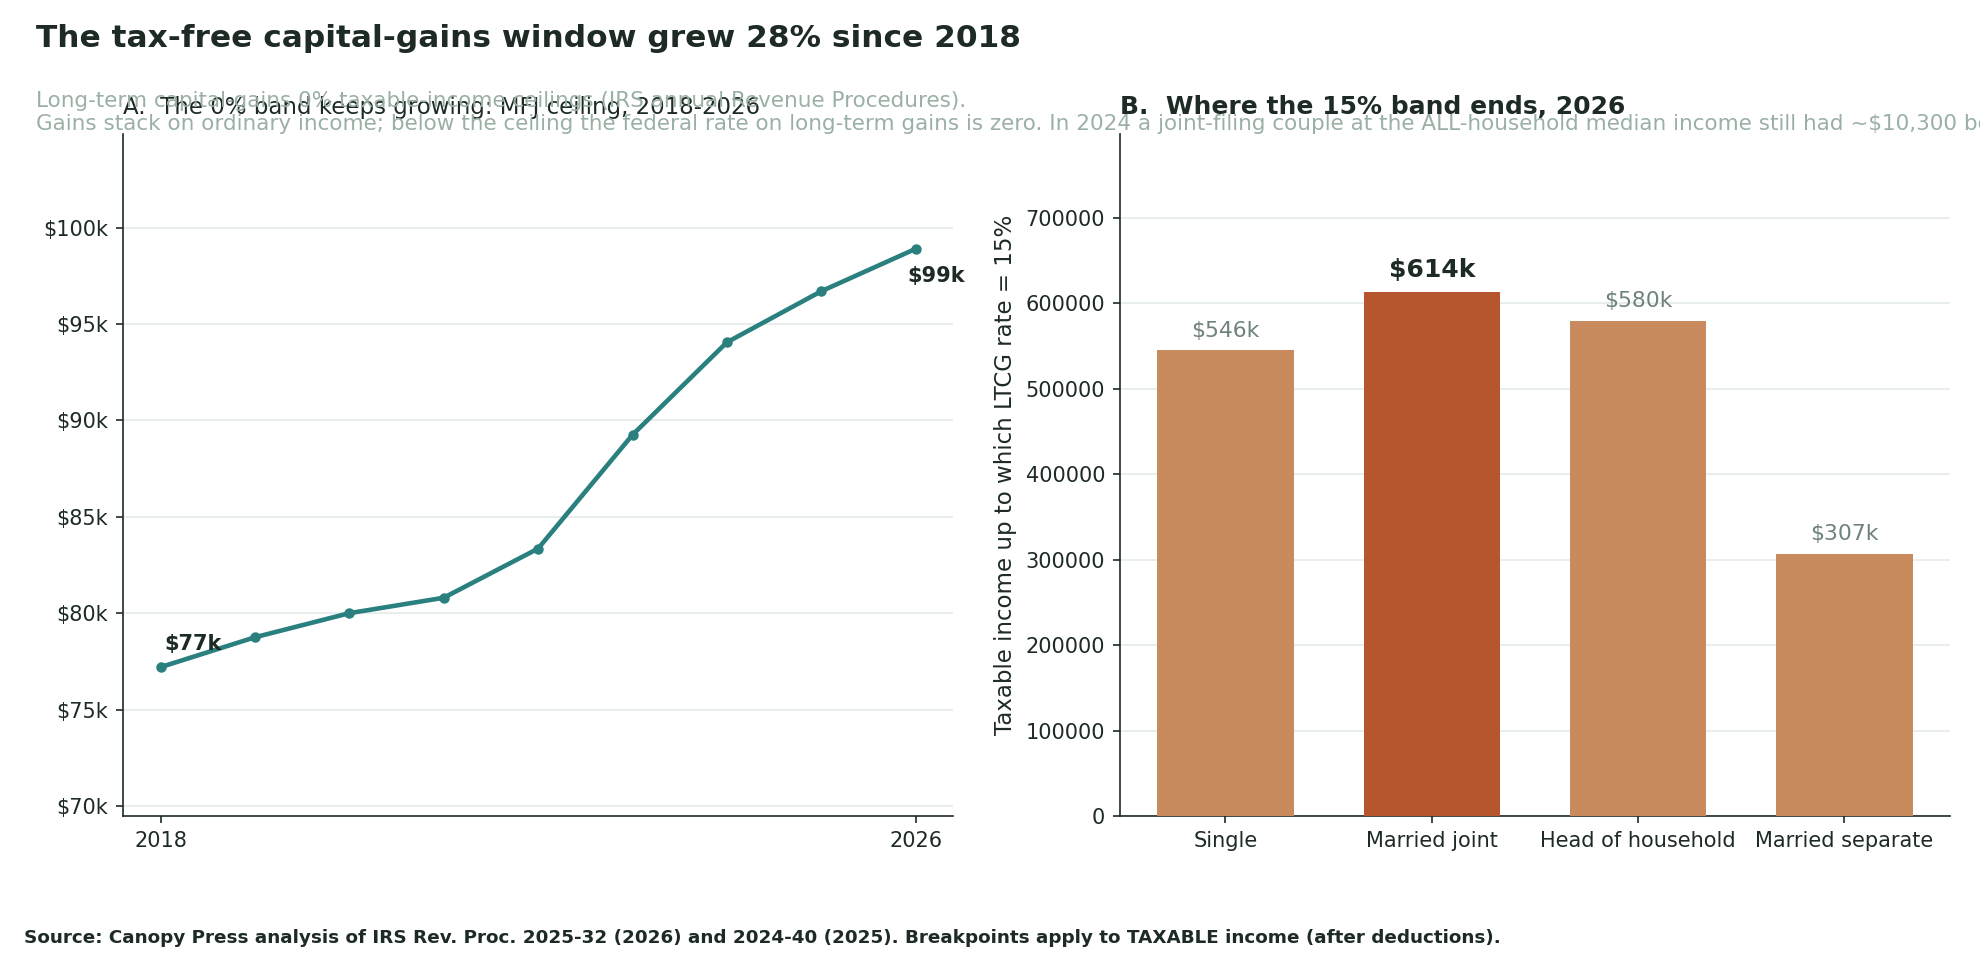
In 2026 a married couple filing jointly pays 0% federal tax on long-term capital gains until taxable income — gain included — passes $98,900. For single filers the ceiling is $49,450. Those breakpoints moved up $2,200 and $1,100 from 2025 — inflation indexing that quietly enlarges the tax-free band every year.
The mechanics matter more than the table: long-term gains stack on top of ordinary income. Ordinary income fills the brackets first; the gain fills whatever room is left in the 0% band, and only the excess spills into 15%. A couple with $75,000 of ordinary taxable income has $23,900 of 0% headroom in 2026 — that much long-term gain can be realized federally tax-free.
The numbers
Nine years of indexing: the assembled series
Assembled from nine annual Revenue Procedures, the joint-filer 0% ceiling rose from $77,200 in 2018 to $98,900 in 2026 — 28.1% growth from inflation indexing alone. Joining that series against the median income of ALL U.S. households (FRED MEHOINUSA646N — a figure that includes single-person households; married-couple households typically earn more): in 2024, the latest income year, a married couple filing jointly whose gross income equaled that all-household median ($83,730) had $10,320 of room between its GROSS income and the $94,050 taxable-income ceiling ($94,050 − $83,730) — a deliberately conservative floor on the true 0% headroom, since taxable income after deductions runs well below gross (the standard deduction alone would nearly quadruple that room). Even measured this strictly, a joint-filing couple at the all-household median income has a tax-free capital-gains window — a result specific to married-filing-jointly status: a single filer at that same income sits far above the $47,025 single-filer ceiling.
| Filing status | 0% ceiling 2025 | 0% ceiling 2026 | 15% ceiling 2026 |
|---|---|---|---|
| Single | $48,350 | $49,450 | $545,500 |
| Married joint | $96,700 | $98,900 | $613,700 |
| Head of household | $64,750 | $66,200 | $579,600 |
| Married separate | $48,350 | $49,450 | $306,850 |
Above the 15% ceiling ($613,700 for joint filers), the rate is 20%. And above modified adjusted gross income (MAGI) of $250,000 (joint) or $200,000 (single), or $125,000 (married filing separately), the 3.8% Net Investment Income Tax stacks on top — thresholds enacted in 2010 (effective 2013) and never indexed, so inflation pulls more households over it every year.
Worked headroom examples, 2026
- Married filing jointly, $75,000 taxable ordinary income: $23,900 of long-term gain at 0%.
- Single filer, $40,000 taxable ordinary income: $9,450 of gain at 0%.
- Either case: gains beyond the headroom are taxed at 15% only on the excess — realizing more does not retroactively tax the sheltered portion.
What this measures — and what it doesn't
Taxable income, not salary. Every ceiling here applies to taxable income after deductions — a couple grossing $130,000 takes the 2026 standard deduction of $32,200 (IRS Rev. Proc. 2025-32), leaving $97,800 of taxable income — still under the $98,900 ceiling. Federal only: state capital-gains taxes are excluded. Long-term only: assets held a year or less are taxed as ordinary income. The statutory values are reproduced from the cited IRS Revenue Procedures via Canopy Press's pinned, hand-verified limits file; the only computed figures are the differences and headroom arithmetic.
IRS annual Revenue Procedures 2018-2026 (2026 values per Rev. Proc. 2025-32; 2025 per 2024-40); NIIT thresholds per IRC 1411; median household income per FRED series MEHOINUSA646N (Census money income, all households). Data + CSV: reuse permitted with attribution (CC BY 4.0). Download: CSV · SVG.

This is informational, not tax advice; confirm your own numbers with the cited Revenue Procedures or a tax professional.