
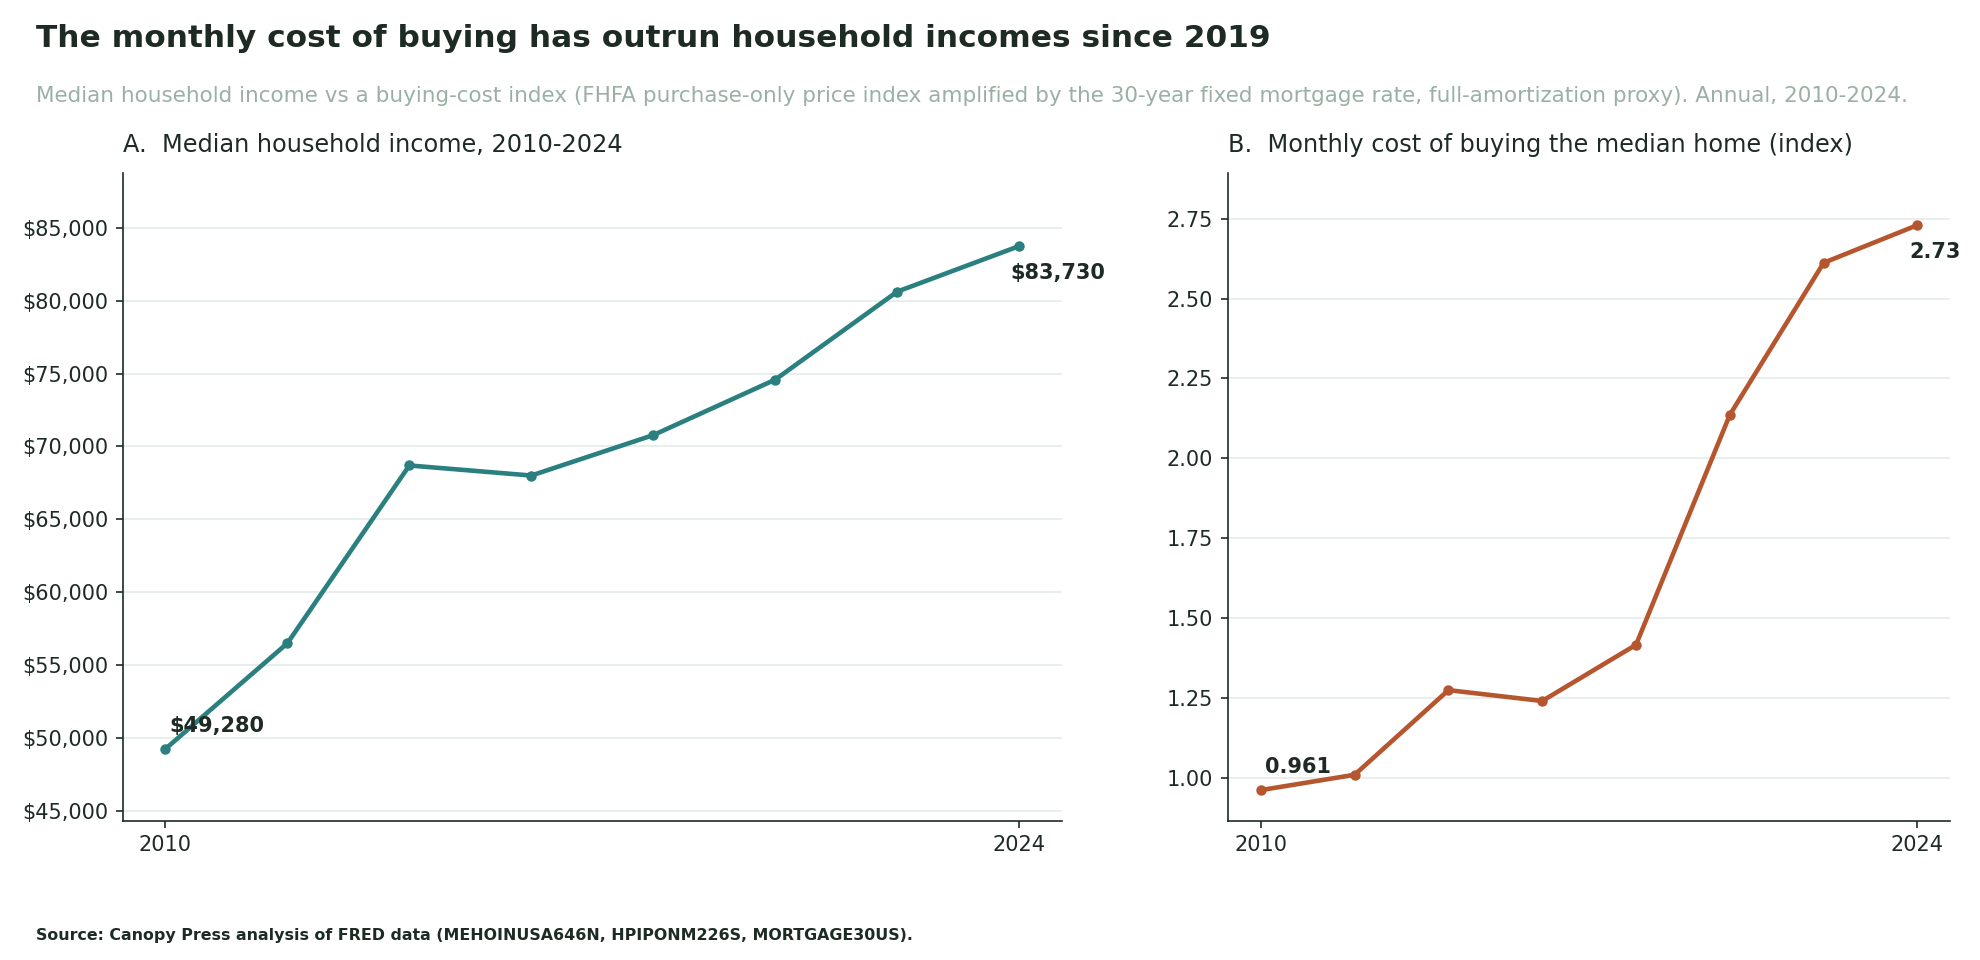
Since 2019, the monthly cost of buying the median U.S. home — house prices amplified by the mortgage rate a new buyer would actually be quoted — has outrun household incomes by roughly 75.8% — the buying-cost growth factor (2.143x) divided by the income growth factor (1.219x). Our buying-cost index rose 114.3% between 2019 and 2024, while median household income rose 21.9% (FRED MEHOINUSA646N). That gap is why a paycheck that comfortably carried a mortgage in 2019 doesn't stretch nearly as far today.
This is informational, not financial advice. The number to sit with: it isn't that prices rose, or that rates rose — it's that they rose together, and income didn't keep pace. Two forces compounding on the numerator while the denominator crawled is the core of the post-2019 affordability squeeze.

Key takeaways
- The buying-cost index climbed 114.3% from 2019 to 2024; median household income rose 21.9% over the same window.
- On a net basis, buying costs outran incomes by about 75.8% (a 2.143x cost multiple against a 1.219x income multiple).
- Median household income was $68,700 in 2019 and $83,730 in 2024 (FRED MEHOINUSA646N) — a 21.9% nominal rise that the cost of buying still outpaced.
- This measures the cost facing a NEW buyer at the quoted 30-year rate — not the far lower rate most current owners are locked into.
The trajectory, year by year
| Year | Median income | 30-yr rate | P&I per $100k loan | Buying-cost index |
|---|---|---|---|---|
| 2019 | $68,700 | 3.9% | $474 | 1.274 |
| 2020 | $68,010 | 3.1% | $428 | 1.24 |
| 2021 | $70,780 | 3.0% | $419 | 1.416 |
| 2022 | $74,580 | 5.3% | $558 | 2.136 |
| 2023 | $80,610 | 6.8% | $652 | 2.612 |
| 2024 | $83,730 | 6.7% | $647 | 2.73 |
Table note: the buying-cost index column shows raw index units (2019 = 1.274); the growth comparisons in the text are rebased so 2019 = 100. Only growth relative to 2019 is interpretable — the units themselves are arbitrary.
What the buying-cost index measures
The construction. The cost of a monthly mortgage payment moves with two things: the price of the house and the rate on the loan. We combine both. For each year we take the FHFA purchase-only house price index (FRED HPIPONM226S) and multiply it by the standard full-amortization payment factor for a 30-year loan at that year's average 30-year fixed rate (FRED MORTGAGE30US). The result is a single index whose growth tracks how the monthly cost of buying the median home has moved — the reporter's "one burden trajectory." We compare that against nominal median household income (FRED MEHOINUSA646N) to answer whether pay kept up.
Why relative, not dollar. The FHFA series is an index (Jan 1991 = 100), not a dollar price, so the buying-cost index carries arbitrary units — a level of 40 or 400 means nothing on its own. What is meaningful is growth relative to a fixed base. We rebase every comparison to 2019, so the honest claim is "buying costs grew X% faster than income since 2019," never a raw dollar payment we did not observe.
What this measure does not capture
Offered, not paid. The 30-year rate here is the average offered contract rate to prime conforming borrowers (Freddie Mac Primary Mortgage Market Survey, PMMS) — the rate a new buyer would be quoted, not the effective rate paid on the outstanding mortgage stock. Most existing owners are locked in far below today's quotes, so this index reflects the cost of buying now, not the cost carried by people who already own.
Freddie Mac PMMS 30-year fixed average, via FRED MORTGAGE30US. Offered rates exclude variation in points and fees and non-conforming (jumbo, FHA, VA) pricing; annual figures are calendar-year means of weekly observations, so within-year swings are larger than the annual line shows.
The price index is narrow. The FHFA purchase-only index covers only homes financed with conforming conventional mortgages — it excludes cash sales, jumbo loans, and FHA/VA-financed purchases, and it is an index rather than a dollar price level. It captures the direction and pace of prices well; it is not a stand-in for what any specific home costs.
FHFA purchase-only house price index (Jan 1991 = 100, seasonally adjusted), via FRED HPIPONM226S.
Income is nominal money income. Median household income here is nominal money income — pre-tax and excluding capital gains and non-cash benefits — reported as an annual national median. It is not inflation-adjusted, which is appropriate because we compare it against a nominal cost index over the same years. The series is the Census Current Population Survey / CPS ASEC median (via FRED MEHOINUSA646N) — not the American Community Survey — and the 2020 value reflects the Census Bureau's pandemic-disrupted collection (documented nonresponse bias), so the 2020 dip should be read with caution.
Median household income, via FRED MEHOINUSA646N (Census Current Population Survey / CPS ASEC money income — not the American Community Survey).
The index is a proxy. The buying-cost index assumes a constant loan-to-value ratio and full 30-year amortization; its absolute level is in arbitrary units, so only its growth relative to the 2019 base should be read. A buyer's actual payment depends on down payment, closing costs, points, taxes, insurance, and loan type — none of which this single-line index carries, and it likewise sets aside supply-side factors such as housing inventory.
How confident we are
The income and rate series are official and used directly — high confidence. The buying-cost index is a transparent, reproducible construction from those series, not a measured payment; treat its growth as directional and robust, its level as arbitrary. Because every headline figure is expressed relative to 2019, the index-versus-dollar distinction does not affect the conclusion: the monthly cost of buying rose materially faster than incomes across 2019-2024.
Transformed figures are Canopy Press's analysis of the underlying federal data. Reuse permitted with attribution (CC BY 4.0). CSV download.