
The typical American homeowner's property-tax bill varies enormously from one state to the next. In the Census Bureau's 2024 American Community Survey, the median owner-occupied household in New Jersey paid $9,358 a year in real estate taxes — 10.6× the $881 median in West Virginia. Comparing each state's median tax bill to its median home value, the effective rate runs from 0.27% in Hawaii to 1.92% in Illinois — a ratio of medians, not any single home's own rate.
The table below is the full lookup for all 50 states plus DC: the median annual bill (taxes as actually paid), the median home value, and the effective rate — the median bill as a share of the median value. The Census publishes the two medians separately; the per-state rate column is Canopy Press's construction (a ratio of medians, labeled as such).
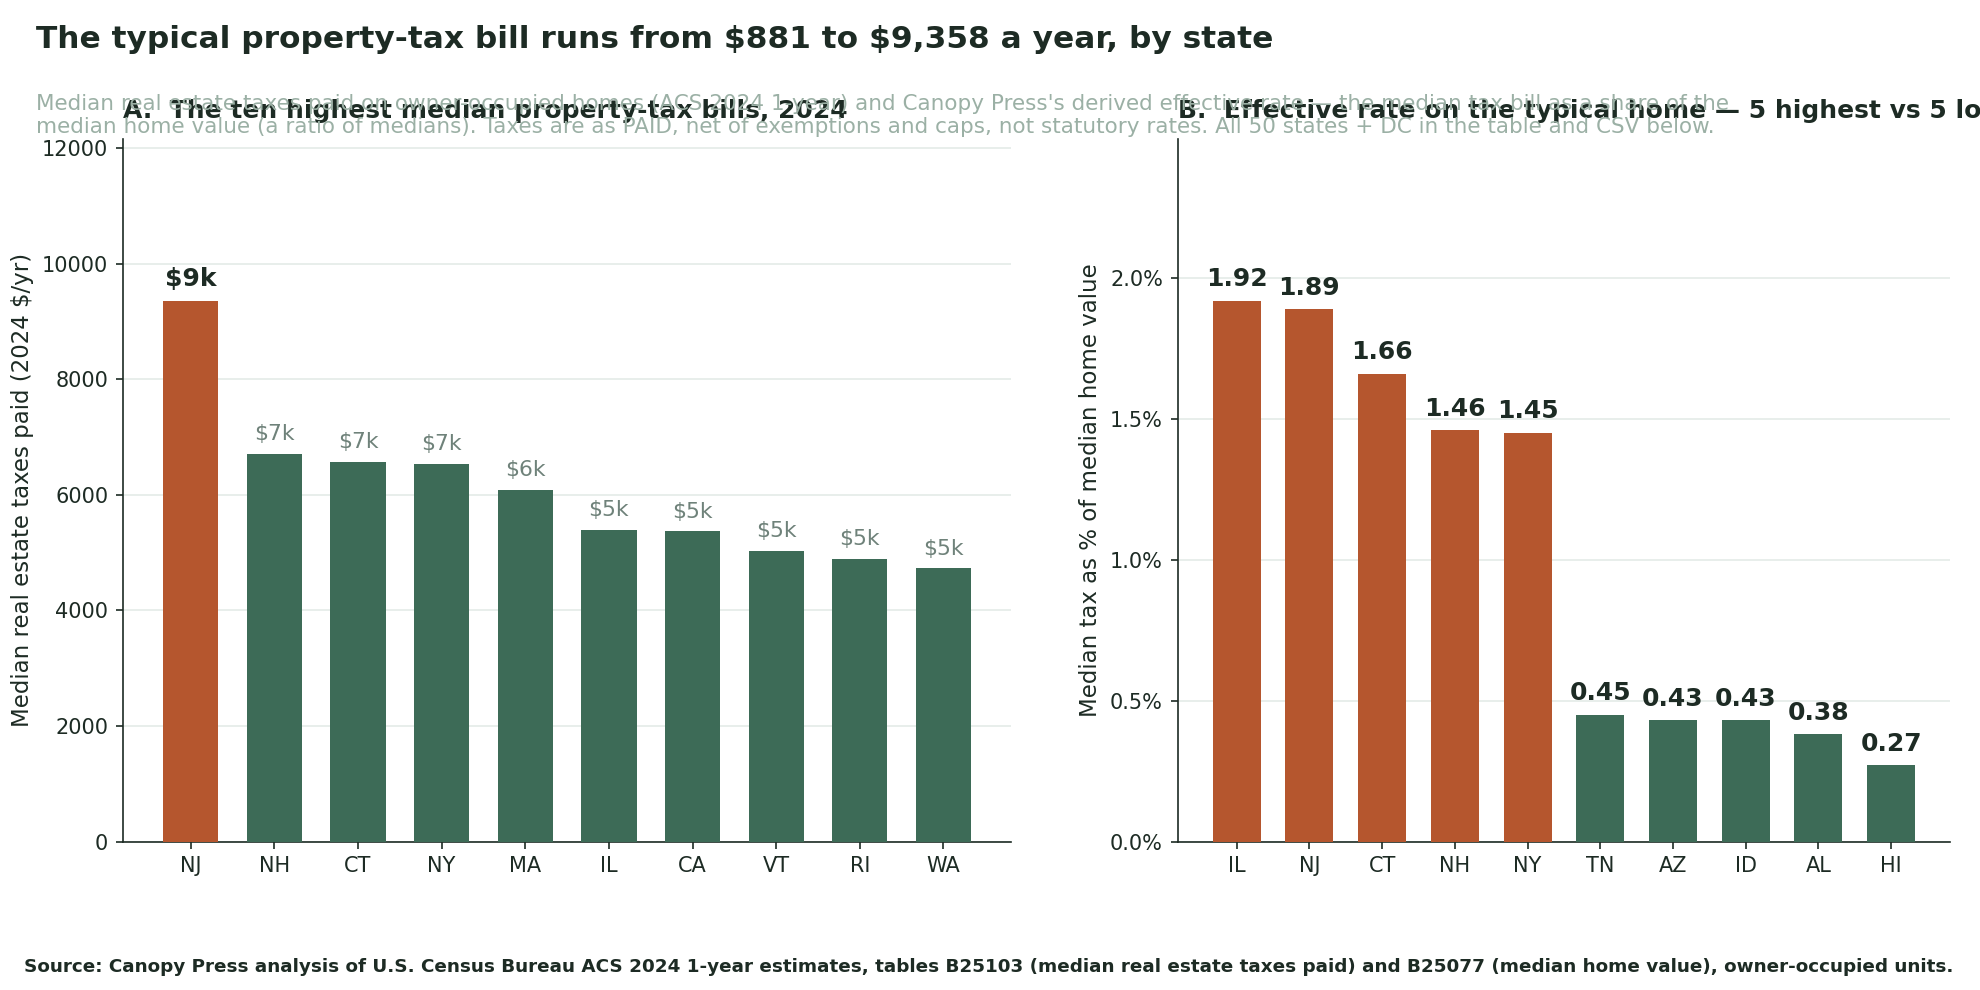

The lookup table: all 50 states + DC, sorted by median bill
| State | Median tax bill (2024) | Median home value | Effective rate (ratio of medians) |
|---|---|---|---|
| NJ | $9,358 | $496,000 | 1.89% |
| NH | $6,707 | $458,800 | 1.46% |
| CT | $6,573 | $396,900 | 1.66% |
| NY | $6,542 | $449,800 | 1.45% |
| MA | $6,080 | $607,400 | 1.00% |
| IL | $5,399 | $280,700 | 1.92% |
| CA | $5,369 | $759,500 | 0.71% |
| VT | $5,026 | $352,800 | 1.42% |
| RI | $4,886 | $455,700 | 1.07% |
| WA | $4,729 | $602,200 | 0.79% |
| DC | $4,594 | $733,400 | 0.63% |
| MD | $4,144 | $436,300 | 0.95% |
| TX | $4,108 | $313,200 | 1.31% |
| AK | $3,976 | $376,500 | 1.06% |
| OR | $3,895 | $497,500 | 0.78% |
| NE | $3,739 | $263,100 | 1.42% |
| WI | $3,680 | $294,700 | 1.25% |
| MN | $3,501 | $344,600 | 1.02% |
| PA | $3,214 | $277,600 | 1.16% |
| ME | $3,103 | $341,900 | 0.91% |
| FL | $2,993 | $396,900 | 0.75% |
| MI | $2,988 | $254,200 | 1.18% |
| KS | $2,983 | $238,700 | 1.25% |
| SD | $2,940 | $289,600 | 1.02% |
| MT | $2,939 | $425,400 | 0.69% |
| IA | $2,937 | $227,300 | 1.29% |
| OH | $2,937 | $239,800 | 1.22% |
| VA | $2,872 | $403,500 | 0.71% |
| CO | $2,828 | $574,600 | 0.49% |
| UT | $2,648 | $545,200 | 0.49% |
| GA | $2,554 | $343,300 | 0.74% |
| ND | $2,550 | $266,100 | 0.96% |
| HI | $2,385 | $875,900 | 0.27% |
| NV | $2,143 | $455,500 | 0.47% |
| NC | $2,044 | $333,000 | 0.61% |
| MO | $2,021 | $254,400 | 0.79% |
| WY | $1,947 | $339,500 | 0.57% |
| ID | $1,912 | $446,400 | 0.43% |
| AZ | $1,828 | $426,000 | 0.43% |
| IN | $1,798 | $243,500 | 0.74% |
| NM | $1,776 | $279,900 | 0.63% |
| DE | $1,750 | $371,600 | 0.47% |
| OK | $1,672 | $222,100 | 0.75% |
| KY | $1,611 | $226,000 | 0.71% |
| TN | $1,488 | $332,600 | 0.45% |
| SC | $1,337 | $299,500 | 0.45% |
| MS | $1,221 | $186,500 | 0.65% |
| LA | $1,187 | $223,200 | 0.53% |
| AR | $1,113 | $215,600 | 0.52% |
| AL | $890 | $233,300 | 0.38% |
| WV | $881 | $170,800 | 0.52% |
Both medians describe owner-occupied housing units in the ACS 2024 1-year estimates. “Effective rate” = median tax ÷ median home value per state — a ratio of medians over the same universe, not the median household's own tax-to-value ratio. Puerto Rico is excluded (different property-tax regime).
How to read your state's number
These are taxes as paid, not rate schedules. B25103 records what owner-occupied households actually paid — after homestead exemptions, senior freezes, assessment caps, and credits. A state with generous exemptions can show a low median bill despite high statutory rates. The figures answer “what does the typical owner pay,” not “what rate would I pay on a new purchase” — reassessment on sale (and big county-to-county differences) can put a new buyer well above the state median.
Bills follow values; rates follow policy. The high-bill list mixes two different stories: states like Illinois and New Jersey tax aggressively relative to value (effective rates near 2%), while coastal high-price states post large bills at moderate rates because the median home itself is expensive (California: $759,500 median value). The rate column separates the two.
Methodology
Source. U.S. Census Bureau, American Community Survey 2024 1-year estimates (the latest release), tables B25103 (“Median real estate taxes paid,” owner-occupied units) and B25077 (“Median value”), fetched for all states from the Census Data API and pinned (checksummed) before computation. Values are carried verbatim; the only computed column is the effective rate.
The derived rate. effective_rate = 100 × median tax ÷ median value, per state. Because both medians describe the same universe (owner-occupied units) but different units within it, the quotient is a ratio of medians — a benchmark of the typical bill against the typical value, not any single household's rate. The ACS does not publish this rate; that construction is the reason this table exists.
Limits. Owner-reported values lag market prices in rising markets, so effective rates here can run slightly above what current transaction prices would imply. ACS 1-year estimates carry margins of error; adjacent states separated by a few dollars or hundredths of a point should be read as ties. Within-state variation is large and not captured.
Confidence. High for the published medians (verbatim federal estimates, pinned snapshot); the effective-rate column is deterministic arithmetic on those medians, labeled as a ratio of medians throughout.
Transformed figures are Canopy Press’s analysis of the underlying federal data, not “Census Bureau data.” Reuse permitted with attribution to Canopy Press (CC BY 4.0). Full underlying figures: CSV download. Source: U.S. Census Bureau, American Community Survey 2024 1-year estimates, tables B25103 and B25077.