
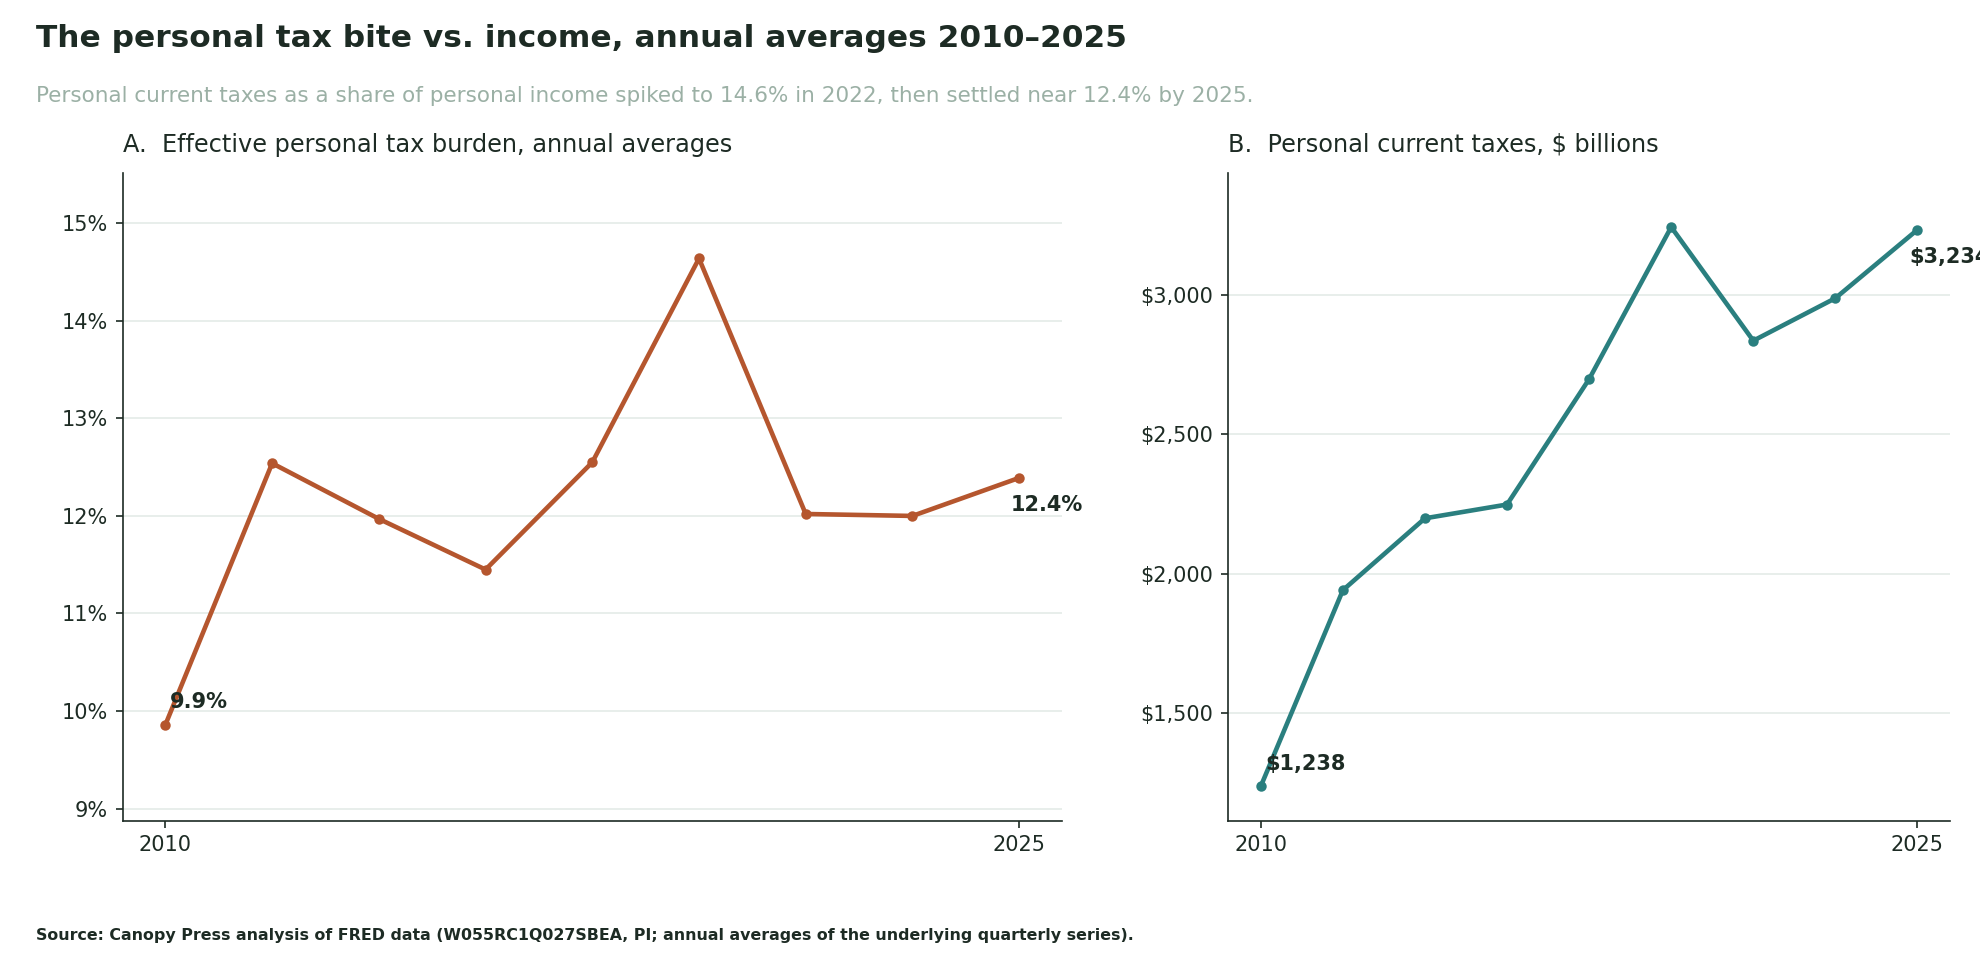
Personal current taxes claimed 12.39% of U.S. personal income in 2025 — up from 11.97% in 2019, but down sharply from the 14.64% spike of 2022 — though it remains well above the 9.86% burden of 2010; the burden climbed to its higher plateau by the mid-2010s and has stayed near it since. This analysis covers only the two national series that can be reproduced directly from BEA-via-FRED data — personal income and personal current taxes — so it describes the tax bite, not housing costs; no mortgage-rate, house-price, or household-income comparison is drawn.

What the numbers show
Take taxes as a share of income and the trajectory is not a runaway. The burden did shift up structurally earlier in the window — from 9.86% in 2010 to 12.54% by 2015 — and has hovered near that higher plateau since; the point here is that the 2022 spike above that plateau, not the plateau itself, was the anomaly. The effective burden sat at 11.97% in 2019, dipped to 11.45% in the 2020 downturn, then jumped to 14.64% in 2022 as total personal current taxes rose faster than income (the two-series data here does not break out which taxes drove the increase). By 2023 it had reverted to roughly 12% and, after a milder 2025 uptick, sat at 12.39% — about four-tenths of a point above the 2019 reading. Between 2019 and 2025, personal income grew from roughly $18.4 trillion to $26.1 trillion, and personal current taxes broadly grew with it — with two notable exceptions. In the 2021–22 run-up, taxes outpaced income enough to push the ratio to 14.64%; the reversion was faster still, taking a single year — back to 12.02% in 2023, holding at 12.0% in 2024 — before a milder second uptick to 12.39% in 2025 as taxes again grew a bit faster than income. That 2025 reading is still provisional.
The table
| Year | Personal current taxes ($B) | Personal income ($B) | Effective burden |
|---|---|---|---|
| 2010 | $1,238 | $12,557 | 9.86% |
| 2019 | $2,199 | $18,363 | 11.97% |
| 2022 | $3,243 | $22,154 | 14.64% |
| 2024 | $2,988 | $24,906 | 12.0% |
| 2025 | $3,234 | $26,100 | 12.39% |
Methodology
The metric. We divide personal current taxes (Federal Reserve Economic Data (FRED) series W055RC1Q027SBEA, a Bureau of Economic Analysis (BEA) series) by personal income (FRED PI, also from the BEA) and express it as a percent — the effective personal tax burden. Both are calendar-year means of the underlying higher-frequency observations (W055RC1Q027SBEA quarterly; PI monthly). The effective-burden percentages in the table are computed from these unrounded underlying BEA series, so recomputing a row from the rounded dollar columns can differ by about 0.01 percentage point — for example, the 2019 row's rounded $2,199B ÷ $18,363B yields 11.98%, versus the 11.97% shown. 'Personal current taxes' covers all personal taxes — federal and state income taxes plus other personal taxes — not the income tax alone, and the denominator is personal income, a broad BEA aggregate rather than taxable income, so this effective rate sits well below any statutory bracket. It is a tax measure, not a housing-cost measure: mortgage-rate, house-price, and household-income series are not part of this dataset, so no housing comparison is drawn.
What it can't tell you. These are national aggregates — whole-country totals. They describe the average tax bite across the United States, not any individual household's, and they hide all variation by income, age, or state. A high earner in a high-tax state and a retiree with mostly Social Security income are averaged into the same ratio. The annual figures also smooth real timing: within-year swings in both taxes and income are larger than the calendar-year means shown here.
Vintage. The BEA revises both series repeatedly as more complete tax and income data arrive. The numbers here are a pinned fetch vintage; the most recent years — especially 2024 and 2025 — are provisional and will move in future revisions. In particular, the 2025 tick-up in the burden is provisional and may shrink or reverse entirely as more complete BEA data arrive. Observations were pulled through rate-limit backoff and pinned at fetch time so the recompute is reproducible.
Underlying series: Personal current taxes (W055RC1Q027SBEA) and Personal income (PI), both BEA via FRED. Transformed figures are Canopy Press's analysis of the underlying federal data. Reuse permitted with attribution (CC BY 4.0). CSV download.